GDP and per capita income
India's economy is now the fifth largest in the world and is growing faster than most comparable countries. At the individual level, however, it is some distance from the world's richest countries.
India's economy is now the fifth largest in the world.
The size of a country's economy is measured in terms of the gross domestic product. The GDP is the sum of the monetary value of everything that is produced in the country, or in other words, everything that is consumed, invested in and exported out of the country.
India's GDP
GDP is measured in local currency terms, and it is converted to US dollars using the prevailing exchange rate in that period to make international comparisons. India's GDP in 2023[1] was Rs 300 trillion (Rs 300 lakh crore). In dollar terms, it was $3.7 trillion.
The Indian economy is projected to be the fourth largest in the world by 2024[2] and the third largest by 2027[3].
GDP growth
GDP growth is the change in GDP over time. It is used by governments, corporations, central banks and multilateral institutions to project national revenues, forecast demand for goods and services, assess future earnings from investments, among other calculations.
When the GDP is calculated at current or prevailing prices in the local currency, that is called the nominal GDP. However this might mask the effect of rising prices - the GDP may have grown but if at the same time the prices of food and other inputs went up at the same rate, then that doesn't translate to material improvements in life in the country. As a result, economists adjust the effect of inflation or price growth, to get what is called the real GDP. For this, they look at GDP growth assuming that prices have remained the same as at a particular point in time. In the last decade, while India's nominal GDP (at current prices) has grown at an average rate[4] of 10.9%, real GDP (at constant 2011-12 prices) has grown at 5.6% per year. The difference between the two rates of growth is one measure of the general inflation in that year[5].
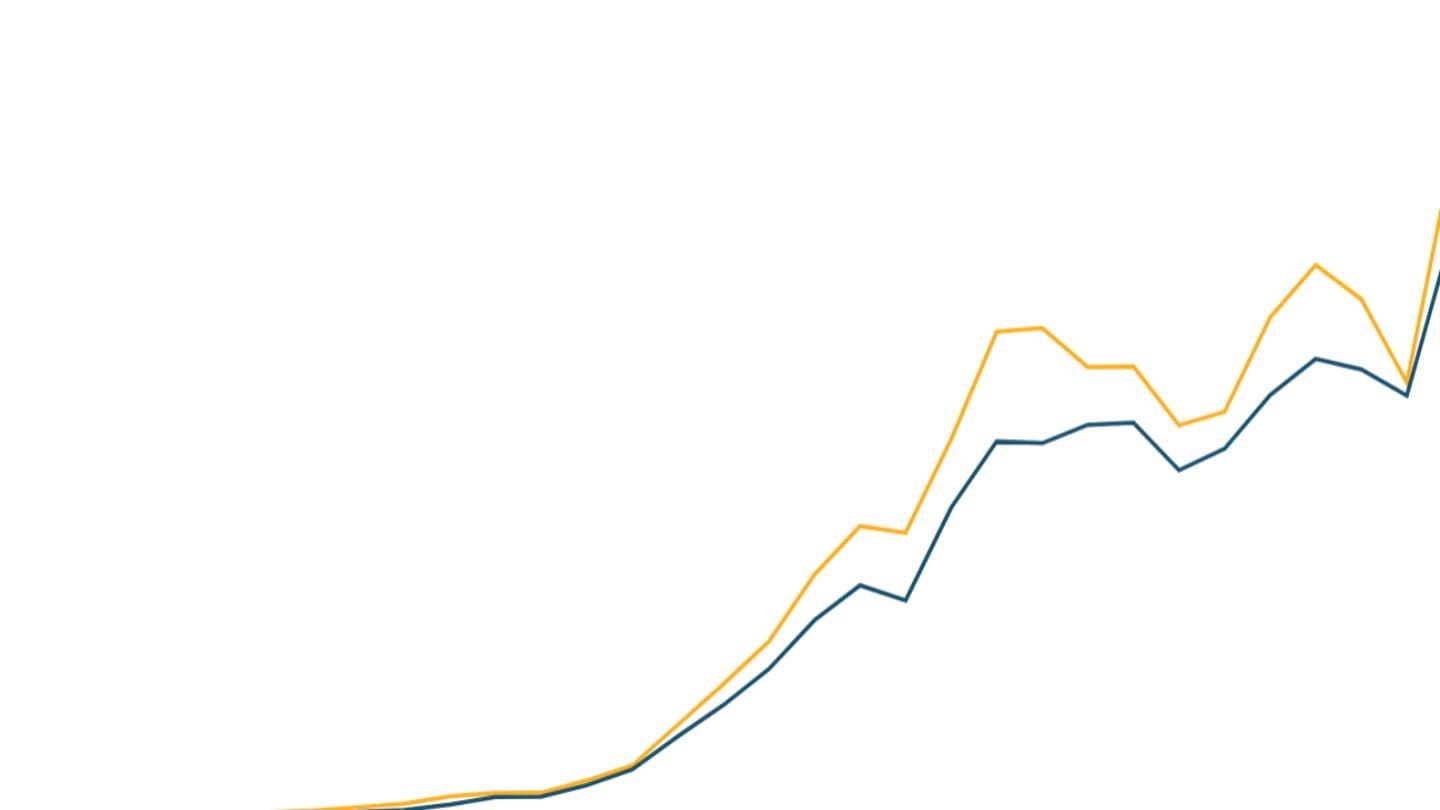
After decades of growing far slower than East Asian countries and than the world average, GDP growth in India took off from the 1980s. Since the 2010s, India has become one of the world's fastest growing economies, with its post-pandemic growth rates in particular being higher than those of many emerging economies including China.
Per capita income
While the GDP reflects the total size of a country's economy and is important to understand how big a market that country represents, it does not on its own give a sense of individual well-being. A country with a small population might have a smaller GDP than a larger one, but on average each individual in the smaller country lives a better life. As a result, looking at the country's GDP relative to its population produces a better picture of what well-being in the country looks like.
The per capita income is the GDP divided by population[6]. India's per capita income was Rs 185,854 in 2023[7]. In dollar terms, India's per capita income in 2022[8] was $2,388 per year, according to the World Bank. This means that while India was fifth among 200 countries in terms of total GDP, it was 158th out of 200 countries in terms of GDP per capita.
Purchasing power parity
Comparisons between countries can sometimes become tricky, because the prices that people have to pay for goods and services are markedly different - one US dollar can buy a lot more in rural India than it can in New York City.
As a result, economists and organisations making such comparisons often make these comparisons in terms of purchasing power parity (PPP). The PPP method creates a unit of measurement called the international dollar that can buy the same amount of goods and services in any country[9].
The UK's per capita income in 2022 in US dollar terms was 20 times that of India's. But comparing the two countries in per capita terms shows that part of the gap is explained by the difference in prices in the two countries; the UK's per capita income in purchasing power parity terms was less than seven times that of India's.
Is per capita income the best way to understand people's wellbeing?
The per capita income is a crude measure of individual income - it does not actually estimate an average individual's income, but is simply the national income divided by the population. We do not have data on all individual incomes - only 7% of working-age Indians file income tax returns.[10]
Another way to understand individual incomes would have been through household surveys. However India's official household surveys measure only spending[11] and not incomes, because many individuals with multiple small jobs, or with seasonal agricultural incomes could find it hard to accurately answer how much their annual income is.
In broad terms, however, a country's per capita income correlates well with other development outcomes like health and education - the richer a country gets on the whole, the more likely it is that its people's wellbeing improves. People in richer countries live longer than those in poorer countries, for instance.
Measuring GDP
A country's GDP is the monetary value of all the goods and services that are being produced during a particular period[12]. It is the most fundamental economic indicator and allows us to understand the extent of economic activity in a country.
There are two key ways of understanding and measuring the GDP. One is the expenditure approach, where everything that is spent by the government and individuals in a year is added up to estimate GDP. In this approach, the GDP is calculated by adding private spending on consumption (food, health, education, etc.), government spending, private and public investment (machinery, factories), and net exports[13].
The second is the production approach, which looks at the value of all goods and services produced in the country, and results in a related measure called the Gross Value Added in the economy, or the GVA. To measure the GVA, a country must measure the volume of output in all sectors and sub-sectors and multiply it by prices to get the value added. The value of inputs and intermediate goods[14] is subtracted.
A third way of measuring the GDP is the income approach which is broadly the sum of all incomes generated in the country. Countries like India and the United States use it to measure part of the value added, especially the value added by public sector companies like the railways.
India's national statistical office measures and presents national economic data in the first two ways: at the expenditure side (private and government consumption, and investments), and at the production side (agriculture, manufacturing, and services). For example, India's gross domestic product using the expenditure approach was Rs 294 trillion for the financial year 2023-24. The gross value added using the production approach was Rs 267 trillion[15]. The difference of Rs 27 trillion between the GDP and the GVA is equal to indirect taxes collected by all tiers of the government minus subsidies provided by all tiers of the government.
However, the calculation of the GDP presents serious challenges, particularly in a developing country like India, where a large share of enterprises in the country do not maintain books of accounts, and are not registered with any authority - family-run grocery stores, or small farmers who sell their produce to local buyers without any record, for example[16]. The value added by such enterprises has to be imputed using some assumptions and statistical calculations.
All GDP estimates are benchmarked to the year when the particular accounting series begins, called the base year. To create a new national accounts series, a new base year is decided every few years. In the current national accounts series, the base year is 2011-12. In this series, nominal GDP for 2019-20 would be calculated by multiplying the volume of goods and services produced by prices prevailing in 2019-20. Real GDP for 2019-20 would be calculated using the volume of 2019-20 and prices of 2011-12.
[1] Corresponds to the financial year April 2023 to March 24
[2] While most countries of the world consider the calendar year itself as the financial year, India's financial year runs from April of one year to the March of the next. For instance, data for 2023 in the IMF or World Bank database refers to January - December 2023 for the US, but April 2023 - March 2024 for India.
[3] Projections come from the International Monetary Fund
[4] Compounded annual growth rate, or CAGR
[5] In macroeconomic theory, the difference between real GDP growth and nominal GDP growth is known as the price deflator. It is a function of wholesale and retail inflation in that period.
[6] There are several alternative indicators that are derived from the GDP. India's national statistical office uses per capita net national income as the measure of per capita income. The gross national income includes the value of the production by all citizens of a country regardless of whether they produce it in the country or not. Net national income is when we adjust for depreciation of fixed assets from gross national income.
This is nominal data.
[7] Corresponds to the financial year April 2023 to March 24
[8] 2023 data for many countries has not yet been updated in the World Bank database.
[9] The PPP is produced by the International Comparison Program at the World Bank
[10] 70 million individuals filed income tax returns in India in the financial year 2022-23, according to the Income Tax Department. India's working age population is close to one billion.
[11] The average monthly per person expenditure on all items as of 2022-23 was Rs 3,860 in rural areas and Rs 6,521 in urban areas. That is significantly lower than the per capita income derived by dividing the national income by the population. (Source: Household Consumption Expenditure Survey 2022-23 Factsheet, National Sample Survey Office)
[12] GDP does not include the following, as the International Monetary Fund notes:
- Domestic responsibilities such as cooking and childcare
- Value of ecological resources and their degradation
- Black market activities
[13] Imports do not form a part of the GDP since they do not represent domestic production
[14] For example, while producing a packet of biscuits, flour and other food products are used, plastic is used for packaging, while the distributors use transport services for last mile reach. The calculation of gross output considers the value of all the intermediate goods and the final product. But the value of the biscuit packet includes the costs of flour, plastic packaging and transport, and this counts the value of intermediate goods twice. To remove the double counting (do not like this specific phrase here), the value added by intermediate goods is subtracted from the value of output to get the gross value added in the economy.
[15] Second advance estimates of national accounts for the financial year 2023-24, National Statistical Office
[16] There are additional challenges. This national accounts series (2011-12) was the first series to use administrative data from the Ministry of Corporate Affairs to determine the value added in the private non-financial corporate sector. However the NSO later found that many of the companies in this administrative database were non-functional.