Enrolment in education
Independent India has brought almost every Indian child into school. But there's still a long way to go with higher education.
One of the most remarkable success stories of modern India has been to bring most children into school. However, keeping young people in education beyond school remains a challenge, and there are stark differences between groups within India.
Enrolment in education
Students in India enrol in primary school at age 6 or grade 1, and secondary school at age 14 or Grade 9. Educational courses after Grade 12 are considered higher education.[1]
Since Independence, the Indian state has had legal obligations to ensure that children are in school. The Indian Constitution, which came into force in 1950, originally stated that the state should endeavour to provide free and compulsory education for all children until the age of 14 within a decade from its adoption. However, it was only in 2002 that education was added as a fundamental right in India's Constitution. In 2009, India passed the Right to Education Act which made elementary education (primary and upper primary, up to grade 8) free and compulsory.[2]
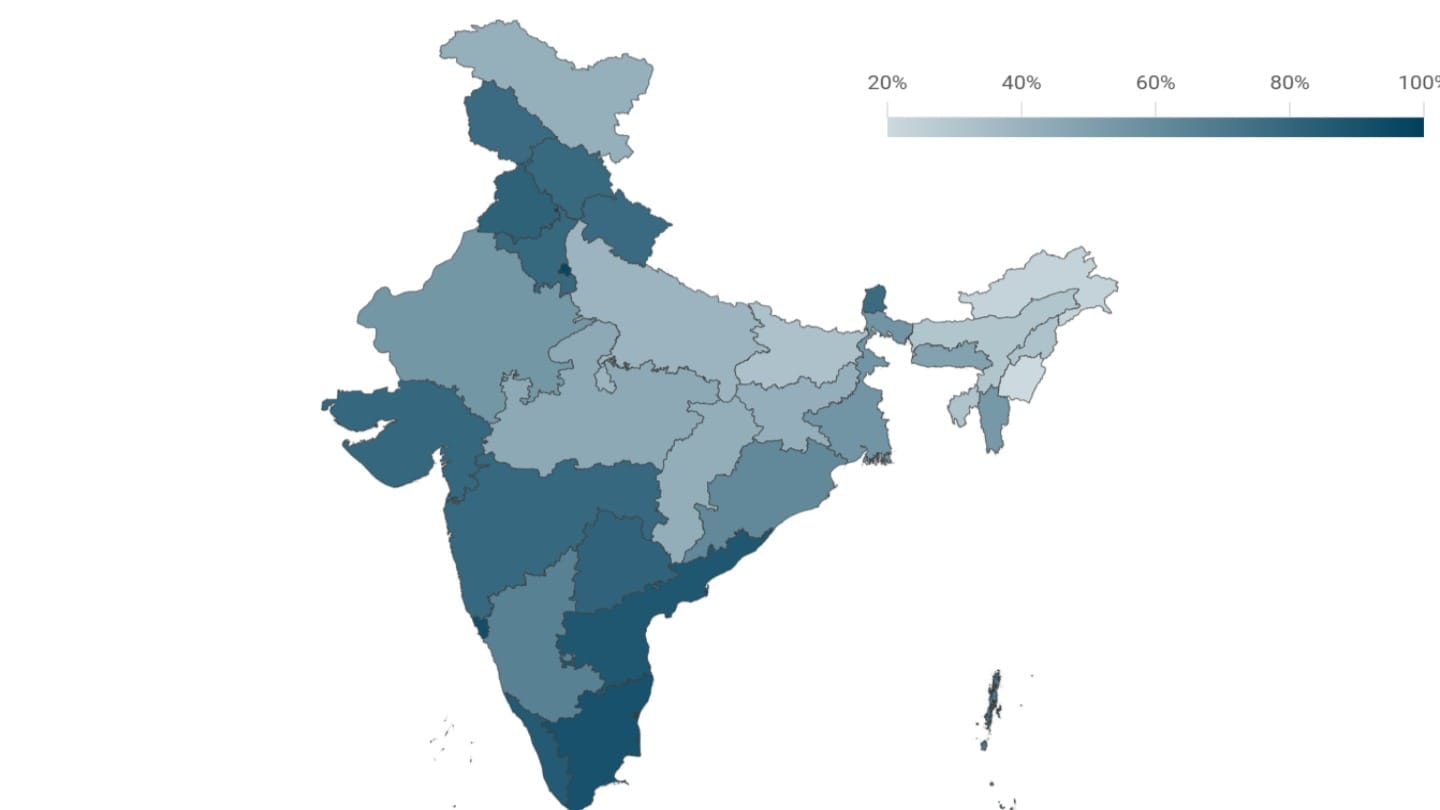
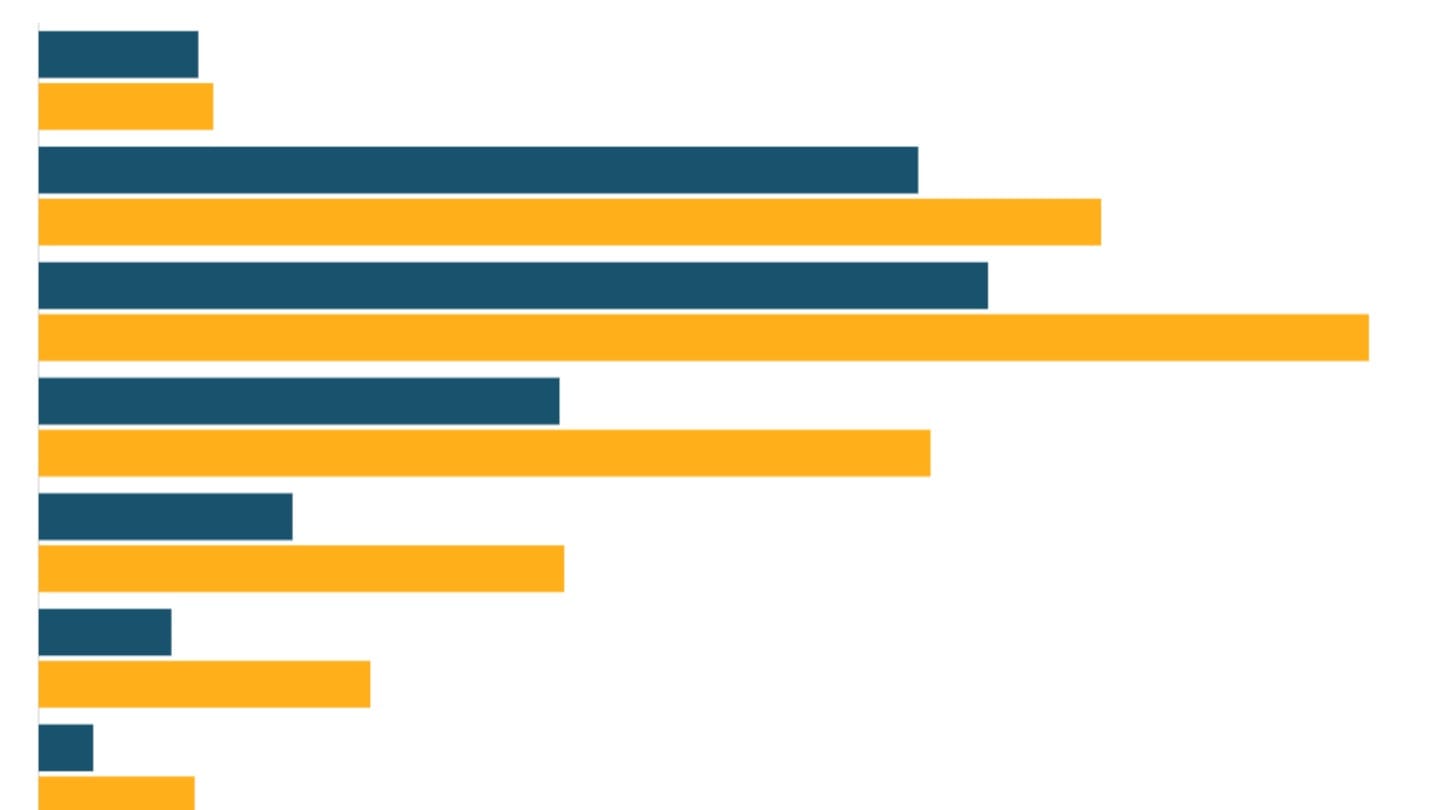
To understand how many children in a particular age group are in school, we look at a measure called the enrolment ratio. The Gross Enrolment Ratio (GER) is the number of children enrolled in an education level relative to their population.[3] At the primary level (Grades 1 to 5), India's gross enrolment ratio is more than 100%. This is as a result of some underage or overage children being enrolled in primary classes.
Thereafter, the gross enrolment ratio declines at each successive stage of education, as more and more children drop out of school.
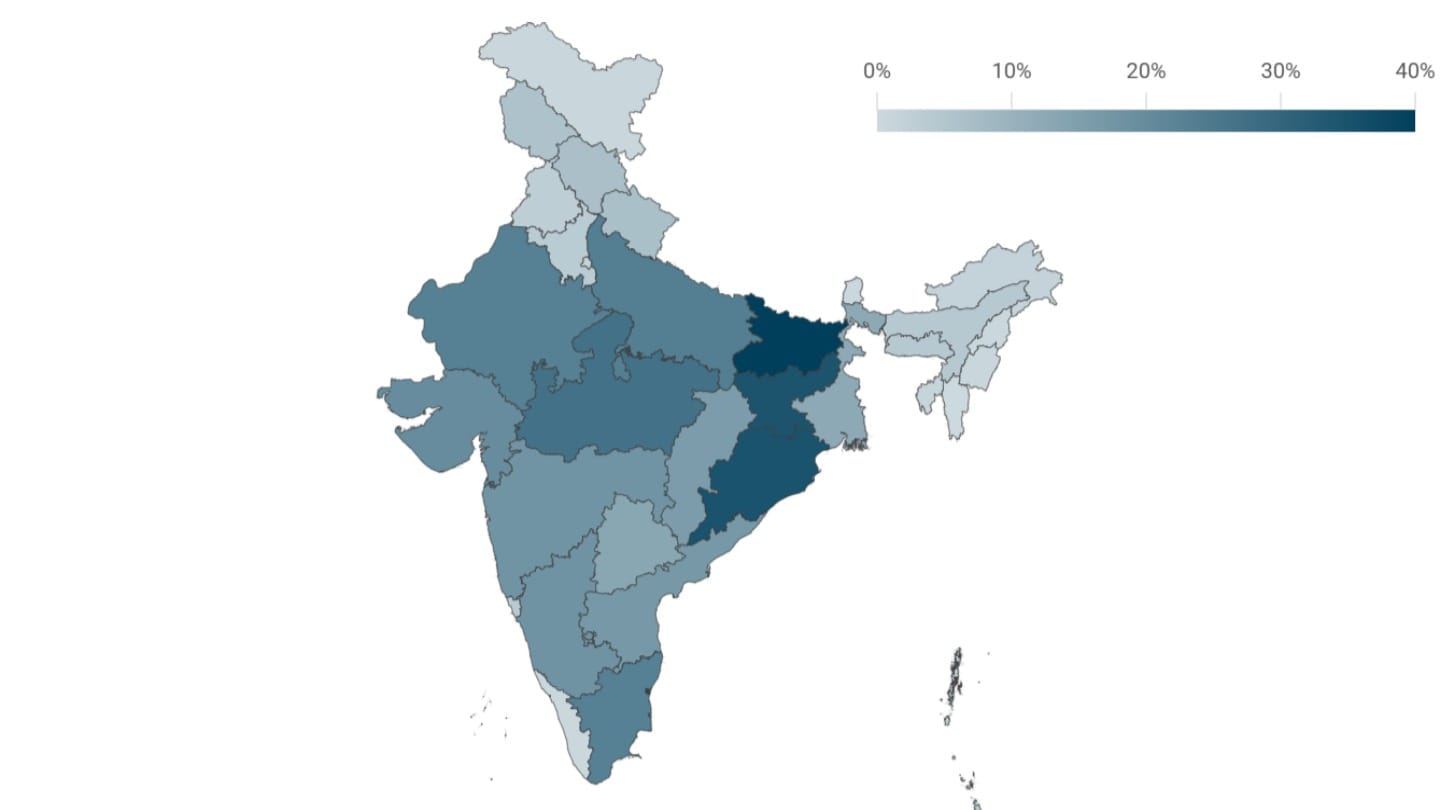
Financial constraints are cited as the top reason by those who drop out of education or do not enrol at all.
Over time, the GER in India has risen at all levels, but most substantially at the elementary level. Enrolment in elementary education peaked in the 2000s, while that in secondary and tertiary (or higher) education grew following that.
Gender parity in enrolment
Beyond the overall growth in enrolment ratios lies yet another significant achievement - the closing of the gender gap in enrolment. In 1951, fewer than three in ten girls were enrolled at the primary level of education against six in ten for boys. At the upper primary level, girls were virtually absent - less than 5% were enrolled. This gap has now been closed; an equal or slightly higher proportion of female students as compared to male students are now enrolled at every stage.
At the secondary level too, female enrolment has caught up with male enrolment, while at higher levels, female enrolment now surpasses that of male students.
India in global context
The enrolment rates of Indian children in elementary and secondary education surpassed the global average in recent years. However, enrolment in tertiary or higher education is still below the world average.[4] In the early 1990s, India's higher education enrolment rates were similar to those of China, for instance. But in the two decades since, China has made big strides, and more than seven in ten young Chinese adults are now in higher education as against three in ten young Indians.
Public and private education
Historically, most children and young people in India studied in institutions run by the government ("public education").
Over the last few decades, the NSO conducted four household surveys that focused on education - in 1995-96,[5] 2007-08,[6] 2014[7] and 2018[8]. Along with the 78th round (Multiple Indicator Survey) and 79th round (Comprehensive Annual Modular Survey), these surveys recorded detailed information on household members who were enrolled at the time of survey, as well as those who had been ever enrolled in the past.
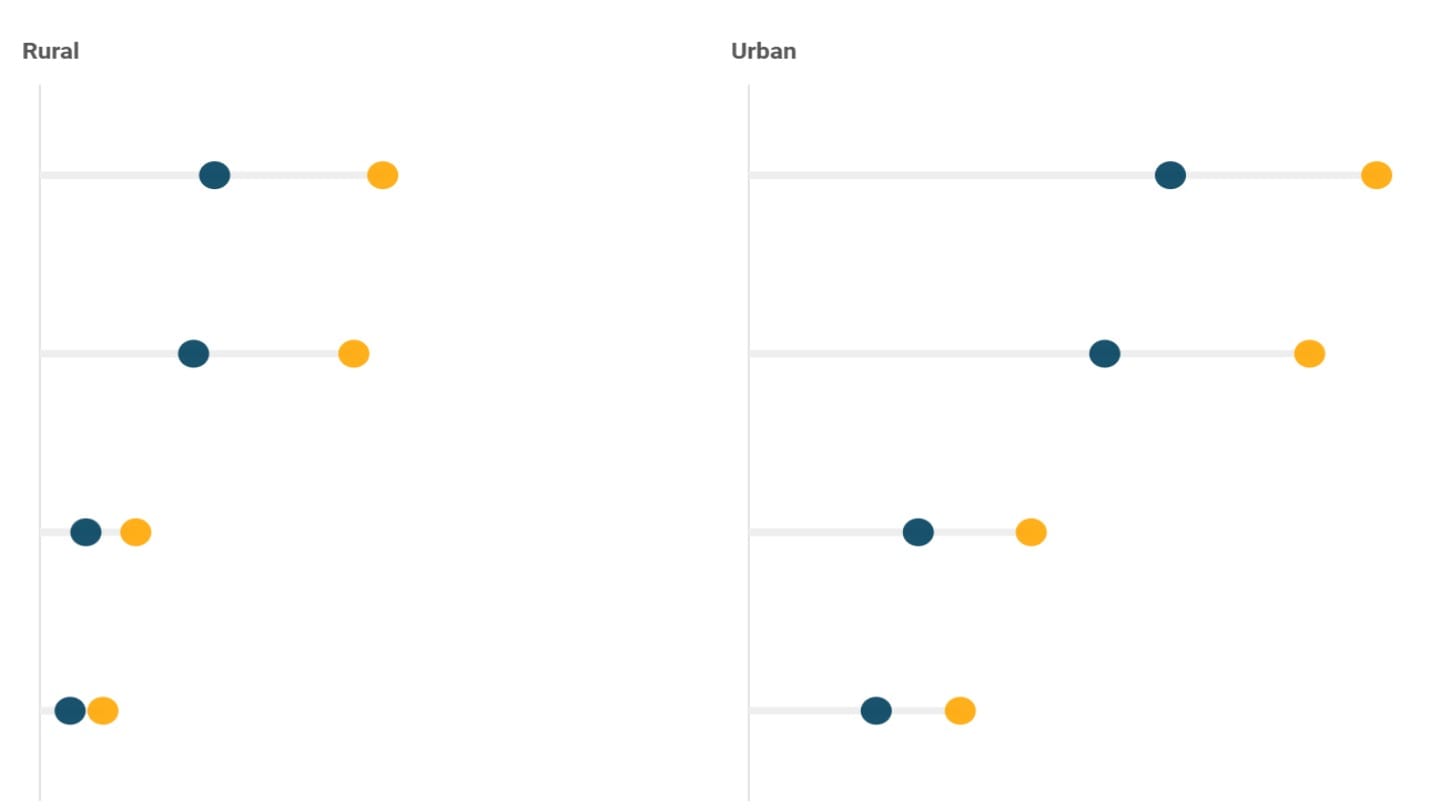
These surveys suggest that while private enrolment is rising in primary education, most students at the secondary and higher education levels study in government-run institutions.[9]
Education data in India
There are two key sources of data when it comes to education in India - administrative data and survey data.
The departments under the Ministry of Education collect data on schools, colleges, universities, teachers, enrolment and educational and general infrastructure every year. While the Department of School Education and Literacy covers pre-primary level to Grade 12 under the Unified District Information System for Education[10] (UDISE), the All India Survey on Higher Education by the Department of Higher Education[11] (AISHE) records data for education beyond Grade 12. These data originate at the level of an educational institution.
The erstwhile Ministry of Human Resource Development began capturing school education statistics in an organised manner at the district level in 2000 (DISE). Structured data on higher education started getting captured from 2007, although the more structured AISHE began only in 2012. The coverage of these statistics improved every year, and the data captured a higher number of indicators over successive years. For instance, the earlier DISE surveys captured dropout rates only at the primary level. In 2013, dropout rates at the secondary level were reported for the first time. This is a key reason we use administrative data such as the UDISE for looking at trends and progress in recent years.
The second major source are surveys - mainly the nationally representative household sample surveys from the National Statistics Office (NSO), and the Census, conducted every ten years (no Census has been conducted in India since 2011). The NSO has conducted five surveys focusing on education from the 1980s to 2018.[12] They record indicators such as the status of enrolment, the level of completed education, reasons for not attending and so on.
Apart from surveys that especially focus on education, basic questions on the completed education level are covered by nearly all NSO surveys, including the Periodic Labour Force Survey, which are conducted frequently and provide the most recent data.
The NSO is the key source of data for years prior to 2000. NSO surveys are also important for some qualitative parameters such as the reasons for dropping out of school, enrolment and attainment by regions (rural and urban) and age group and the type of institution students are studying in. NSO surveys present a view of the data from the household's perspective - so enrolment becomes what households report about where students in the family are studying, rather than what schools report, as in the case of administrative data.
[1] Elementary education is from Grade 1-8 and corresponds to ages 6 to 13. Within elementary education:
Primary level, or Grades 1-5, corresponds to ages 6-10
Upper primary level, or Grades 6-8, corresponds to ages 11-13
Secondary education is from Grades 9-12 and corresponds to ages 14-17. Within secondary education:
Secondary level, or Grades 9-10, corresponds to ages 14-15
Higher secondary level, or Grades 11-12, corresponds to ages 16-17
Higher education includes undergraduate and postgraduate degrees, or equivalent courses and diplomas, and corresponds to ages 18-23
[2] The Right To Education Act of 2009 extends until children are 14 years of age. The age groups used in India's official statistics for measuring enrollment with respect to population, however, consider 6-13 for elementary (primary and upper primary) education
[3] The GER measures enrolment in a particular education level, regardless of the age of the children enrolled. For instance, GER for elementary education (Class 1-8) is the ratio of enrolment in those classes to the total population between ages 6 and 13. Underage or overage students is one of the key reasons enrolment ratio can go above 100%. It may also happen due to grade repeaters.
[4] The World Bank's World Development Indicators term the levels as Primary, Secondary and Tertiary
[5] Participation In Education, NSS 52nd Round, July 1995 - July 1996
[6] Participation and Expenditure in Education, NSS 64th Round, 2007-08
[7] Social Consumption - Education Survey, NSS 71st Round, January 2014 - June 2014
[8] Household Social Consumption: Education, NSS 75th Round, July 2017 - June 2018
[9] The government also collects enrolment data administratively, collated from the records shared by schools and colleges. This administrative data shows higher levels of enrolment in private institutions at all levels of education than what survey data suggests.
[10] School education data for recent years is published on the UDISE Plus management information system.
[11] The first AISHE report was published in 2012-13. Statistics on higher education were released in separate reports before that.
[12] The Ministry of Statistics and Programme Implementation maintains the unit level data for most of the NSSO surveys on the microdata website.


