Measuring consumption expenditure
Consumption expenditure data is vital to the understanding of living standards in India. The latest official data offers a new window, but has also seen key changes in methodology
The most direct way to understand household incomes would be to either use income tax assessment data, or by surveying households on their incomes. However in India, just 7.5% of the adult population files income tax returns[1]. Additionally, India's statistics ministry does not directly survey respondents on their incomes, because the informal nature of most work in India, coupled with the seasonality of agricultural incomes, makes accurately estimating incomes challenging[2]. In such cases, economists use household consumption expenditure as a proxy or substitute for household incomes - consumption expenditure plus savings minus debt broadly equals income.
Household spending is also a good measure of living standards in the population - richer people broadly spend more and on different kinds of things, than poorer people are able to.
India's National Sample Survey Office has conducted household consumer expenditure surveys (HCES) from as early as 1950 to record the amount spent by households on goods and services that they consume for their domestic needs. Trained enumerators carry a questionnaire with a long list of items, and record the quantity and value of the same items for a representative sample of the population.
The past and the present
Consumer expenditure surveys were conducted annually from 1950 to the early 1970s, and once every five years from 1972-73, although there have been deviations from the schedule a few times[3]. The latest survey in the HCES series was conducted in 2022-23, eleven years after the last official survey[4].
The HCES 2023 was conducted between August 2022 and July 2023 in the entire country covering a sample size of more than 250,000 households (more than 150,000 in rural areas and more than 100,000 in urban areas) across all states in India. The sample is designed to be representative of the country in terms of demographic characteristics like region, social group, and income levels.
Enumerators now use a tablet to collect data and have been trained in the Computer Assisted Personal Interviews method. The long questionnaire is divided into three parts, and administered over three visits to each household.
India's household consumption expenditure surveys record the value of consumption in rupees for over 500 goods and services typically consumed by a household. While canvassing, enumerators usually list the item to the respondent and ask the respondent the quantity consumed and amount spent on that item during a fixed reference period. The final numbers presented are calculated for monthly expenditure.
Coverage of goods and services
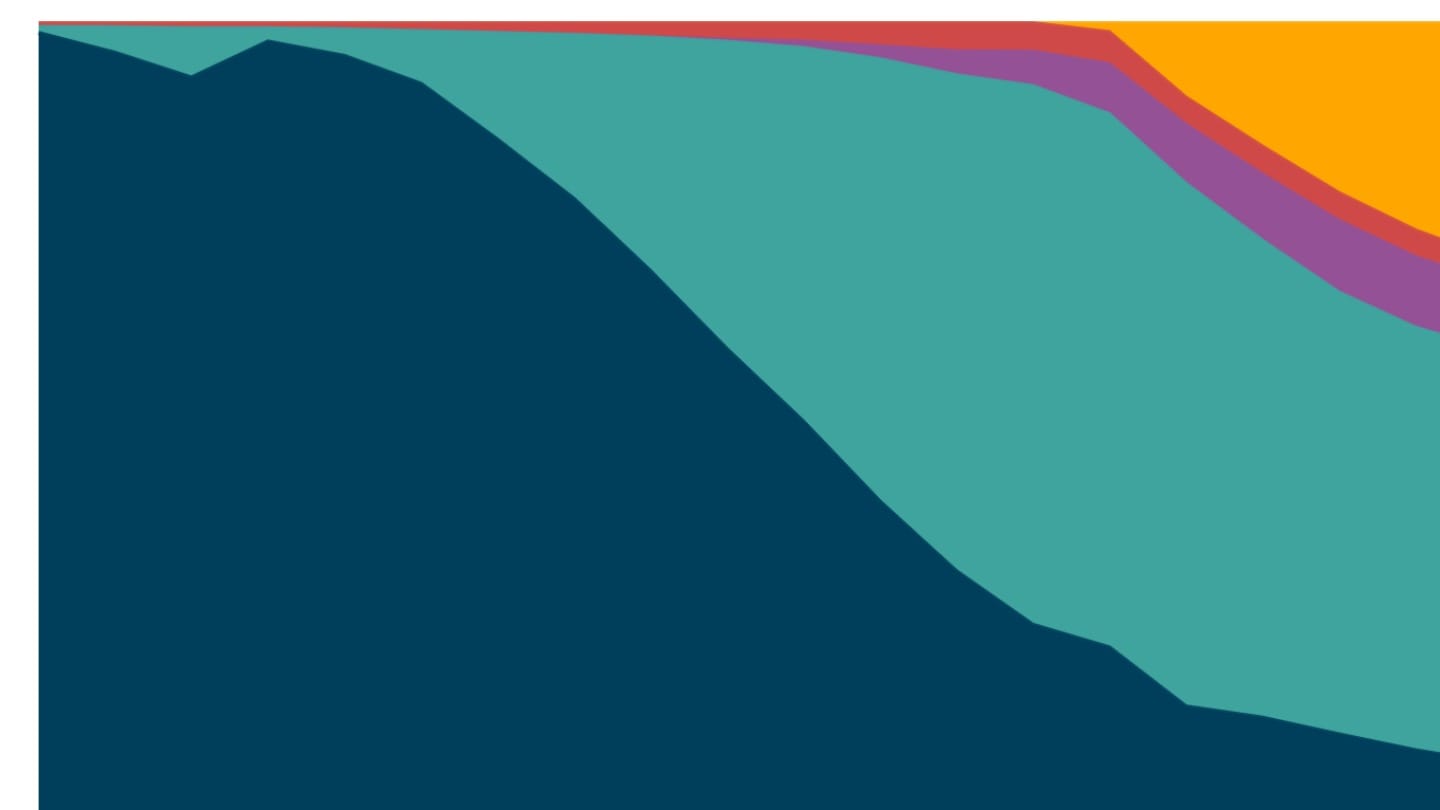
The list of items covered in HCES 2023 includes both food and non-food categories. For food, respondents are asked about their consumption of everything from salt and oil to meats and processed food. Non-food expenditure includes that on household goods like clothing and bath products, services like health and education, rent, major goods purchased during the year including ACs and washing machines, as well as relative luxuries like jewellery and entertainment. It also includes property taxes, utility charges, and government fees.
Consumption expenditure includes the value of items produced in the household or the farm, as well as transfers from employers or the government. Enumerators assign value to food items produced at home by using the quantity and the price at the farm gate, and not the retail price. For others, including transfers in kind or any reimbursements from employers such as travel allowances meant for families, the prevailing local retail prices are used to calculate the value and record that in the data.
The questionnaires do not include income tax, interest payments, insurance, purchase and construction of land and buildings, charity and gifts. While insurance premium is not a part of consumption expenditure, medical bills paid by insurance companies are included in the information collected. The questionnaires do not ask whether money being spent was earned through legal or illegal means
Over the past decades, several items have been added to the canvassing schedule of the HCES, and several others have been removed, to reflect the changes in household spending habits over time. For instance, online purchases of food and household articles and spending on health supplements and sports equipment were added to the HCES 2023.
The enumerator asks one respondent per household - the designated head of the household - for all of the information for the household. This data is added up to produce an estimate of monthly household expenditure. The HCES assumes that spending is equally distributed between all members of the household. Per capita expenditure, as a result, is the household's expenditure divided by the number of people in that household.
Reference periods
The HCES requires the respondent to recall the amount spent on/quantity consumed of a good or service she used during a specific recent period, called a reference period. All expenditures are then normalised to a 30-day period to get the monthly spending.
The HCES uses different reference periods for different types of goods and services. For instance, perishable goods like vegetables and milk have a 7-day reference period owing to their frequent purchases over a week. Cereals have a reference period of 30 days since households do not buy cereals and pulses that frequently, but they generally do on a monthly basis. Expenditures such as those on durable goods, education, and health are borne by households over longer periods, and have a reference period of 365 days.
The mix of reference periods used in HCES 2023 is called the Modified Mixed Reference Period and has been used as the sole reference period for the first time.
Methodological changes
The HCES 2023 differs significantly from the previous versions of HCES (2012 and before) in two ways - the sampling process and in the way the questionnaire was administered.
Sampling procedure
The HCES 2023 made several important changes in the sampling procedure.
The first stage of sampling demarcates the broad contours of regions to be selected for further stratification into smaller regional units, followed by selection of villages (in rural areas) and blocks (in urban areas). Until now, the HCES used the district as the sampling unit. The rural areas in a district formed one division (called stratum) and the urban areas formed another. If the urban part of a district had towns with a population of more than 1 million, that town or city would be considered a separate stratum.
The latest HCES (2023) uses the state as the basic sampling unit. Inside a state, it divides rural areas in two kinds of villages based on proximity to urban centres. Villages within 5 km from the district headquarter or a city form one sub-set (called sub-stratum), while the remaining villages form the second one.
The reasoning behind this change is to ensure that households belonging to different economic strata are represented to a better degree than before. For instance, the population in peri-urban areas or localities in rural areas adjacent to cities has grown, and represents people who are both connected to a farming family as well as have economic links in the city or town. The urban proximity rule mentioned above ensures representation to such a population.
In the urban sector, groups are made using population thresholds. Further sub-grouping in urban areas is done based on whether the block is affluent or not[5].
The second stage of sampling involves the selection of households in the sampling units. In previous versions of HCES, the surveyors divided the rural unit in three parts in the second stage of sampling - the relatively affluent households in the village in the first group, those which earn primarily from non-agricultural activities in the second, and the remaining households in the third.
The recent HCES (2023) makes land ownership a key factor in the sampling process. It creates three groups within a selected village based on land ownership in the following manner. The first group is of households that fall in the top 5% in terms of the size of owned land[6]. The second group is made up of households that appear between the 5th and the 20th percentile, and the third group is the remainder - or the bottom 80% of the households by land ownership size.
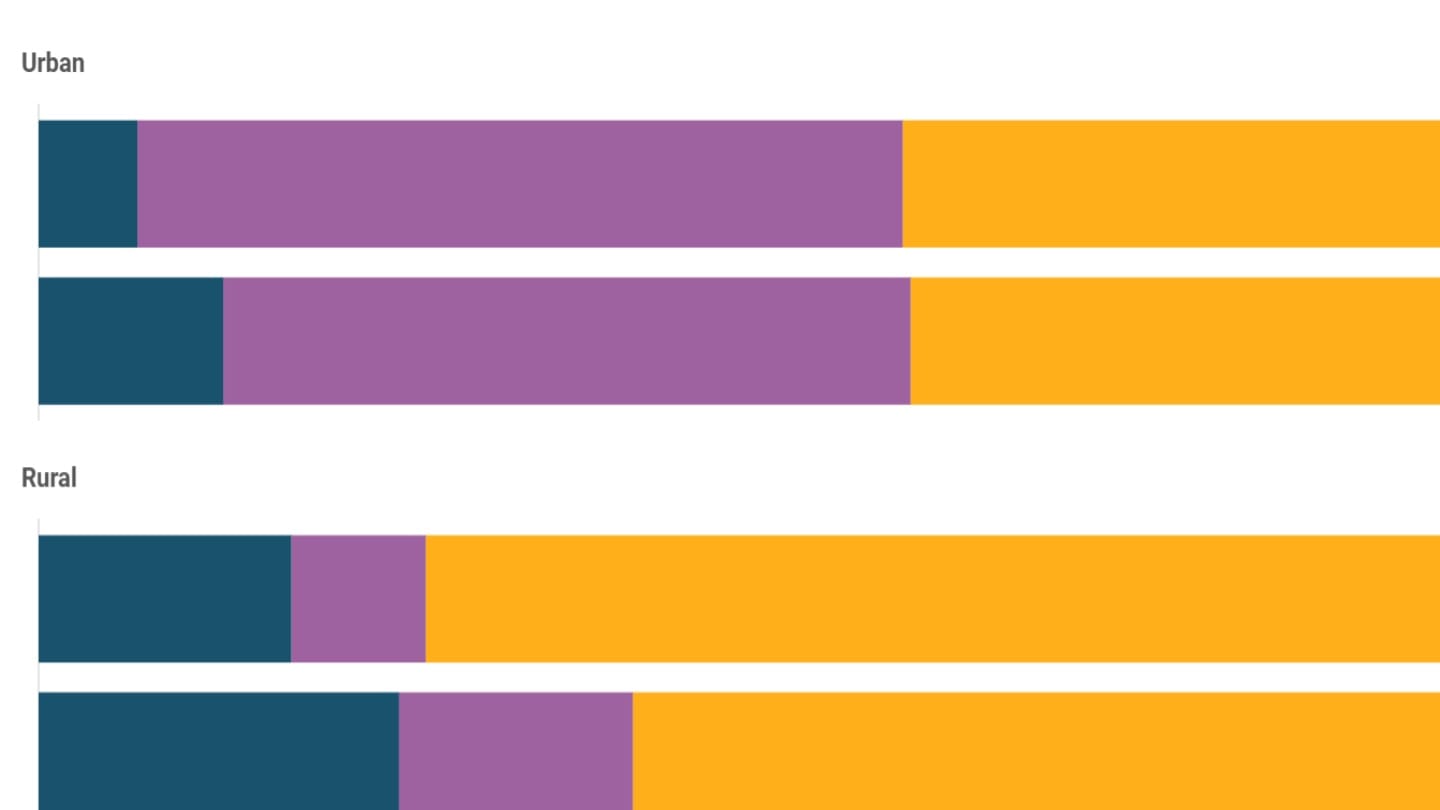
In urban areas, the older HCES divided blocks into three groups based on the MPCE while selecting sample households[7]. The first group of households covered the population falling in the top 10% by MPCE, the second group covering the middle 60% of the population, and the third group covering the bottom 30%.
The recent HCES (2023) creates three groups to select urban sample households based on car ownership instead. The first group comprises the households that own a car or cars whose purchase price is more than Rs 1 million, the second group comprises those who own a car but whose price is less than Rs 1 million (representing entry level cars in India) and the third group is of the remaining households who do not own a car[8].
The use of size of land owned or the purchase value of the car owned are changes brought in by the NSSO that are meant to improve the identification of the affluent for the sample. Land records and car ownership are both easier to measure, and tend to be correlated with the relative economic status of the household. The NSSO's reasoning is that stratification using sampling that looks for tangible assets reflects the actual socio economic scenario in a better manner in the sample households.
Once the three-grouped stratification is made, the number of households selected from each group is in the proportion of population in that group.
Questionnaire administration
While the past surveys recorded the consumption spending on all services and goods in a single visit, the HCES (2023) recorded them in three visits over successive months. The NSSO's reasoning here is that the single-visit method induced respondent fatigue due to the length of the questionnaire and the time taken to canvas it.
The three separate questionnaires covered food, consumables and services, and durable goods, respectively.
The changes in both the sampling procedure and in the canvassing of the questionnaires makes the recent HCES (2023) slightly different from the previous ones. Nevertheless, the NSSO has said in its report that accompanies the data that comparing its results with the previous HCES is valid.
[1] Data refers to the financial year 2022-23, and represents the number of people filing returns in that period. The official projections of population from the Office of the Registrar General and Census Commissioner estimate the adult population to be close to 1 billion in 2023.
[2] The only major national survey that estimates income is the India Human Development Survey conducted jointly by the National Council for Applied Economic Research and the University of Maryland. The latest survey results are expected in 2025.
[3] Household spending surveys from inception till the one conducted in 2011-12 were called Household Consumer Expenditure Surveys. The NSSO renamed the survey as Household Consumption Expenditure Survey from 2022-23. Raw data from the surveys conducted between 1950 and 1973 is not available in the public domain.
[4] The NSSO conducted an HCES in 2017-18, but its results were not published on account of what the government called data quality issues.
[5] Affluence is measured in the Urban Frame Survey (UFS) conducted by the NSSO every few years. Field officials demarcate parts of the urban areas selected in the UFS as "affluent" using their own judgement or with consultation with people who have knowledge or expertise in that region. The most recent UFS was conducted between 2017 and 2022. No such survey exists for rural areas.
[6] Data from the results of a previously conducted survey are used here.
[7] Here too, the MPCE used was derived from the results of a previously conducted survey.
[8] The car is used as a household asset that determines the relative economic status of a household. This method is analogous to the wealth index used in the National Family Health Survey, which categorises sample households into five wealth buckets based on a score derived on the basis of the existence or the lack of basic household amenities, housing conditions, and durable assets.