Over the past few decades, the National Family Health Survey (NFHS) has become an important source of demographic and socioeconomic data for India. But there is one key demographic parameter on which the NFHS has been consistently wrong: India's sex ratio.
Consistent underestimate of the number of males
India has historically had a sex ratio that is skewed towards males; as a result, the sex ratio (females for every 1000 males) is a keenly watched indicator.
The NFHS is a large-sample household survey, meant to be representative at both the national and the state level.[1] To gauge its accuracy in computing the sex ratio, we compare it with India's Census conducted by the Registrar General of India (RGI). Census figures provide a full count of the population, and are used globally to check the reliability or representativeness of survey estimates.[2]
The first three rounds of the NFHS were held in 1992-93, 1998-99, and 2005-06. Since the Census was not conducted in the same years, we use interpolations based on the most recent Censuses (1991, 2001, and 2011) and compare the NFHS's estimated sex ratios with the interpolated census figures for those years.[3]
The next two rounds of the NFHS were conducted in 2015-16 and 2019-21. Since there has not been a Census since 2011, we use population projections made by the Registrar General of India, based on the 2011 Census, as a benchmark for the two most recent NFHS rounds.[4]
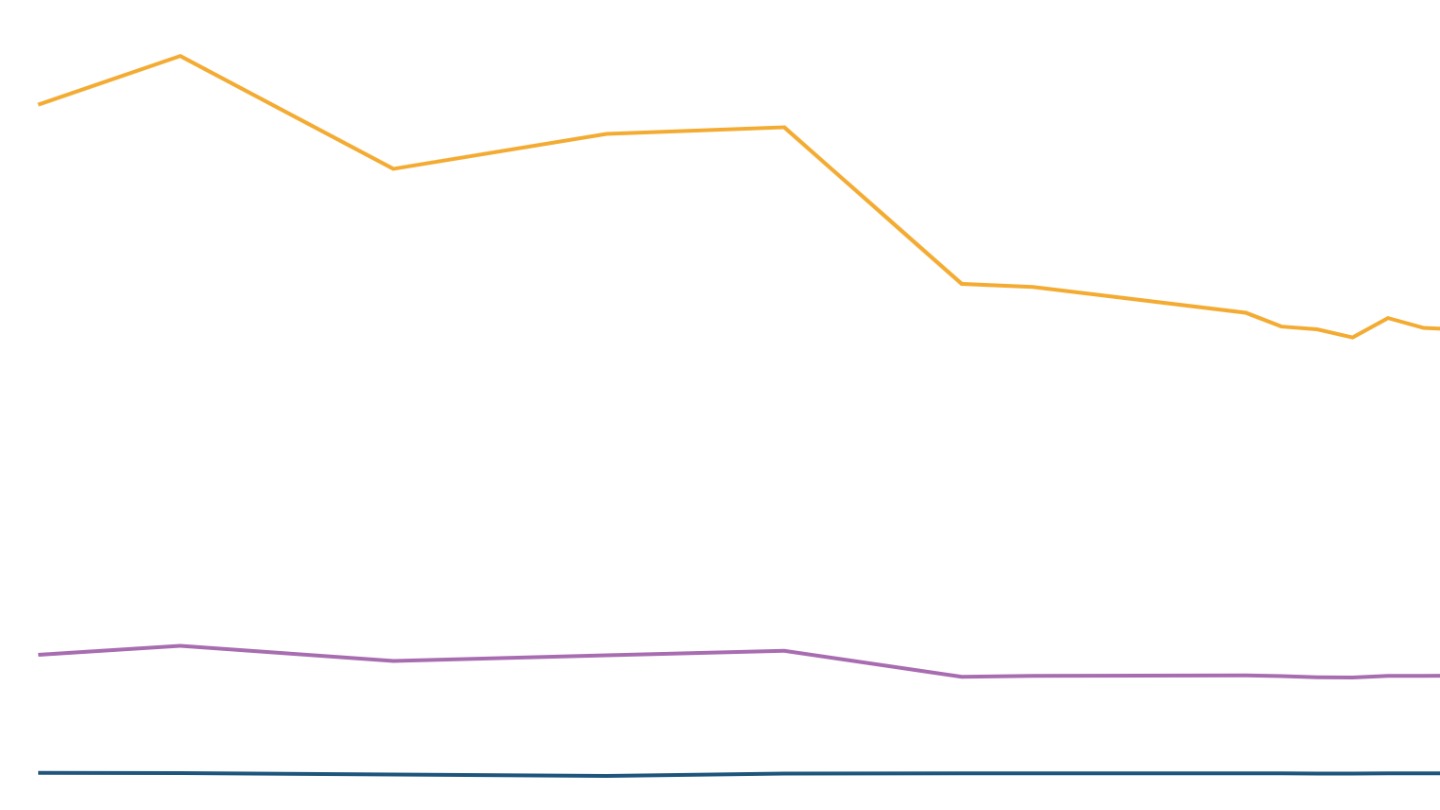
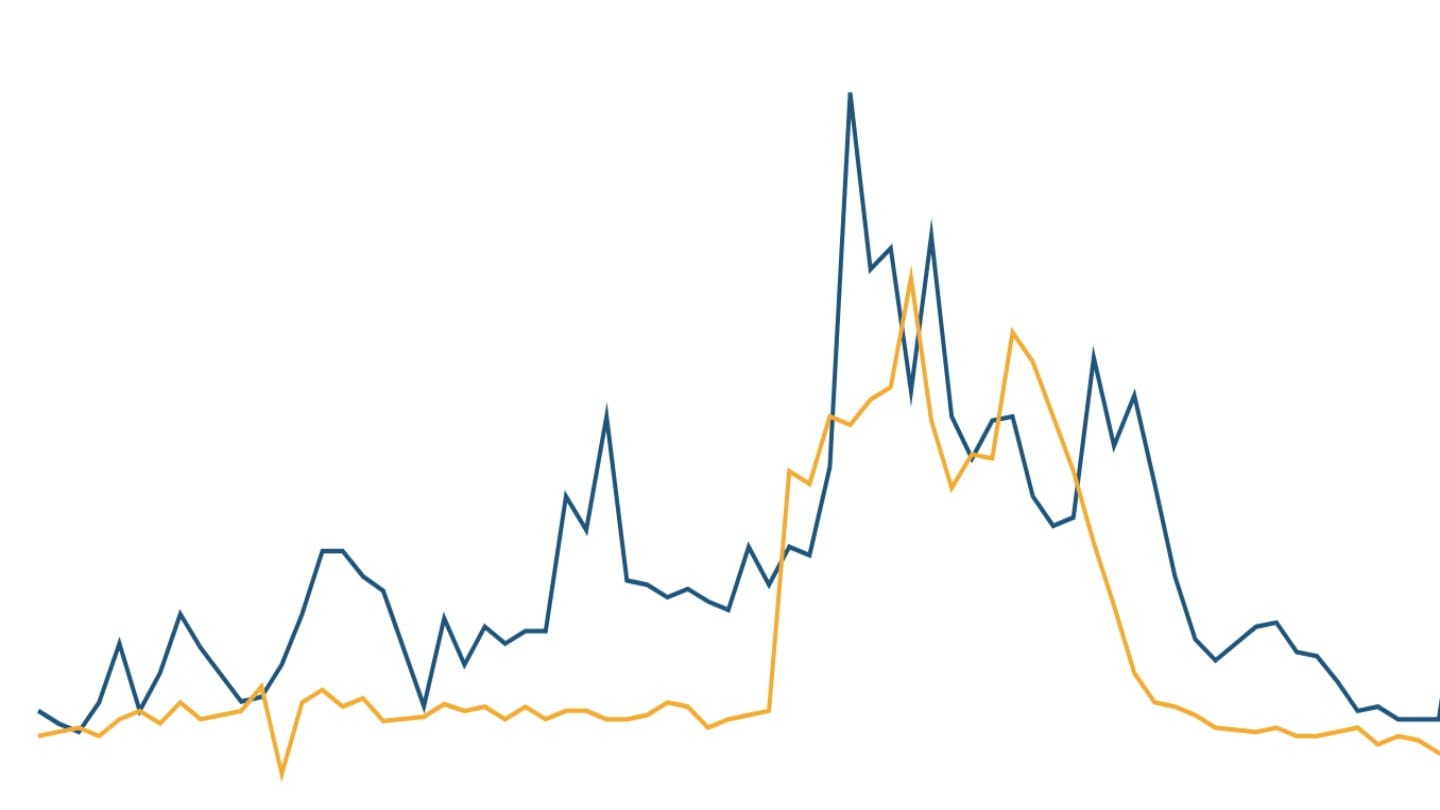
We find that for all the five rounds, the NFHS sex ratio estimates are more female-skewed than the Census and its projections.
A state-wide analysis suggests that this trend holds true for most states across different parts of the country.
The age divide
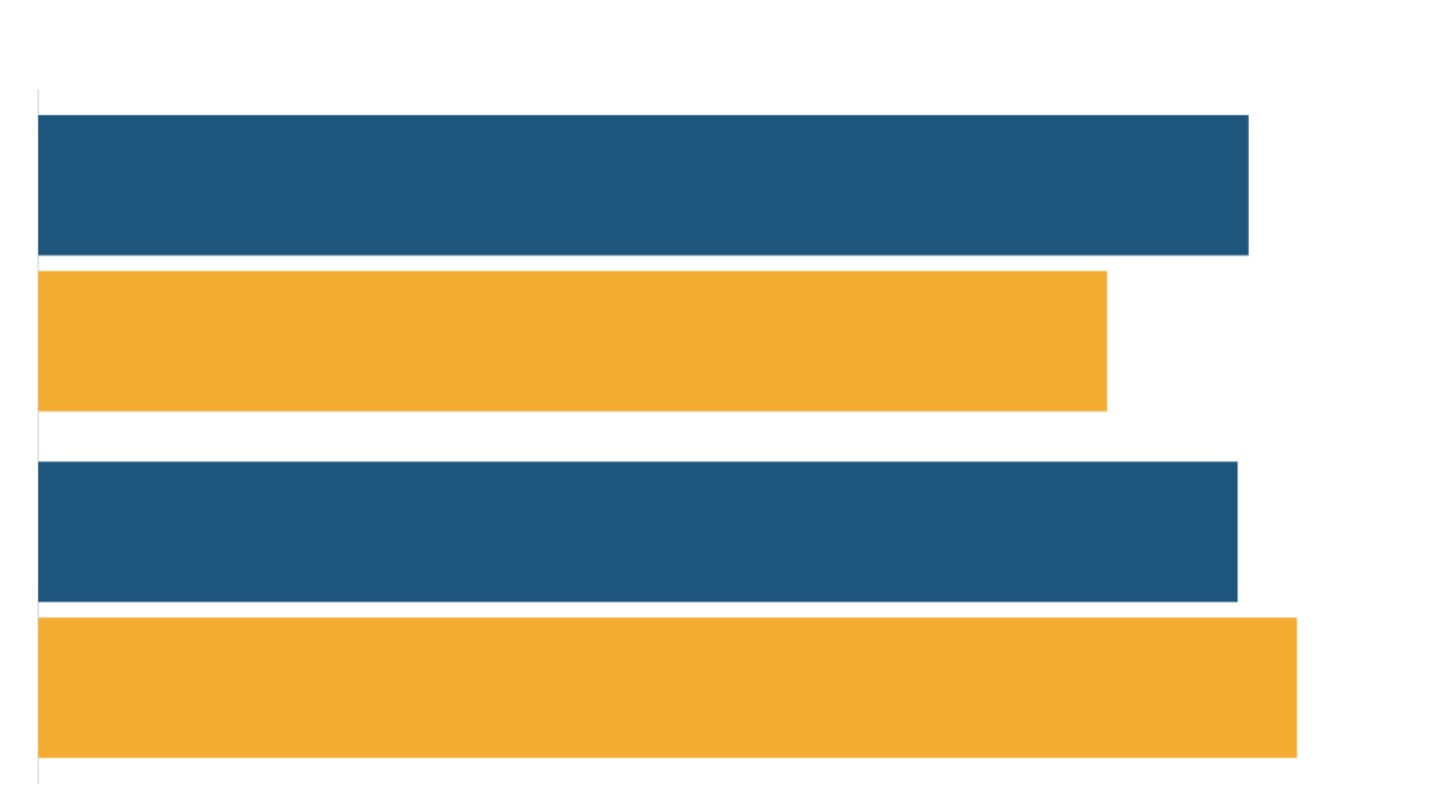
An age group-wise analysis shows that the sex ratios of the 15-59 age group are female-skewed across all NFHS rounds. For the 60+ age group, the sex ratios are male-skewed. In other words, NFHS surveys have provided an undercount of men of working age, and of elderly women. NFHS estimates of sex ratios in the child population (0-14 age group) are relatively closer to the RGI figures.[5]
Why does the NFHS miss men and older women?
Large nationally representative surveys conducted by India's National Statistical Office (NSO) do not suffer from the same biases. State-level sex ratios often go wrong even in NSO's surveys, but the errors do not have any systematic bias. If the sex ratio is more male-skewed in some states, it also tends to be more female-skewed in others, so that at the all-India level, the sex ratio estimates are relatively closer to the RGI's figures.
One reason for the difference between the Census or NSO surveys and NFHS might lie in the definition of what constitutes a household. The NFHS excludes 'institutional households' from its definition of households.[6] So, single men staying in hostels or lodges would be excluded from the NFHS's coverage. In contrast, the Census counts institutional households[7], and NSO surveys include all men staying in a hostel or a lodge as separate 'single-member households'.[8] This explains a small part of the higher estimates for women reported by the NFHS.[9]
Who counts as a member of a given household is also prone to some ambiguity in the NFHS's survey methodology. Unlike in the case of NSO surveys, the definition of "usual household members" to be listed during the household interview is not clearly specified in NFHS manuals. So, the perception of the respondent - typically the household head - determines whether a member is included in the list or not.[10] As a result, a household member who may be away for work temporarily may miss being counted in the household interview. Since men tend to migrate for short-duration work more often than women, their chances of being excluded are higher.
The NFHS itself acknowledges these gaps. The NFHS-1 report attributed the sex ratio gap to the exclusion of institutional and homeless populations in NFHS, and the 'under-enumeration' of females in the decennial census.[11] The NFHS-2 and NFHS-3 reports pointed to rural-urban migration patterns. Since urban sex ratios were lower (less female-skewed) than rural sex ratios, the reports suggested that the trends were driven by male migration from villages to cities. The NFHS-4 and NFHS-5 reports have not addressed this issue.
While these factors may partly explain the undercount of male migrant workers in the NFHS, they do not explain the systematic undercount of elderly women. This suggests that there could be other factors behind the gaps in the NFHS's coverage.[12]
The global gap
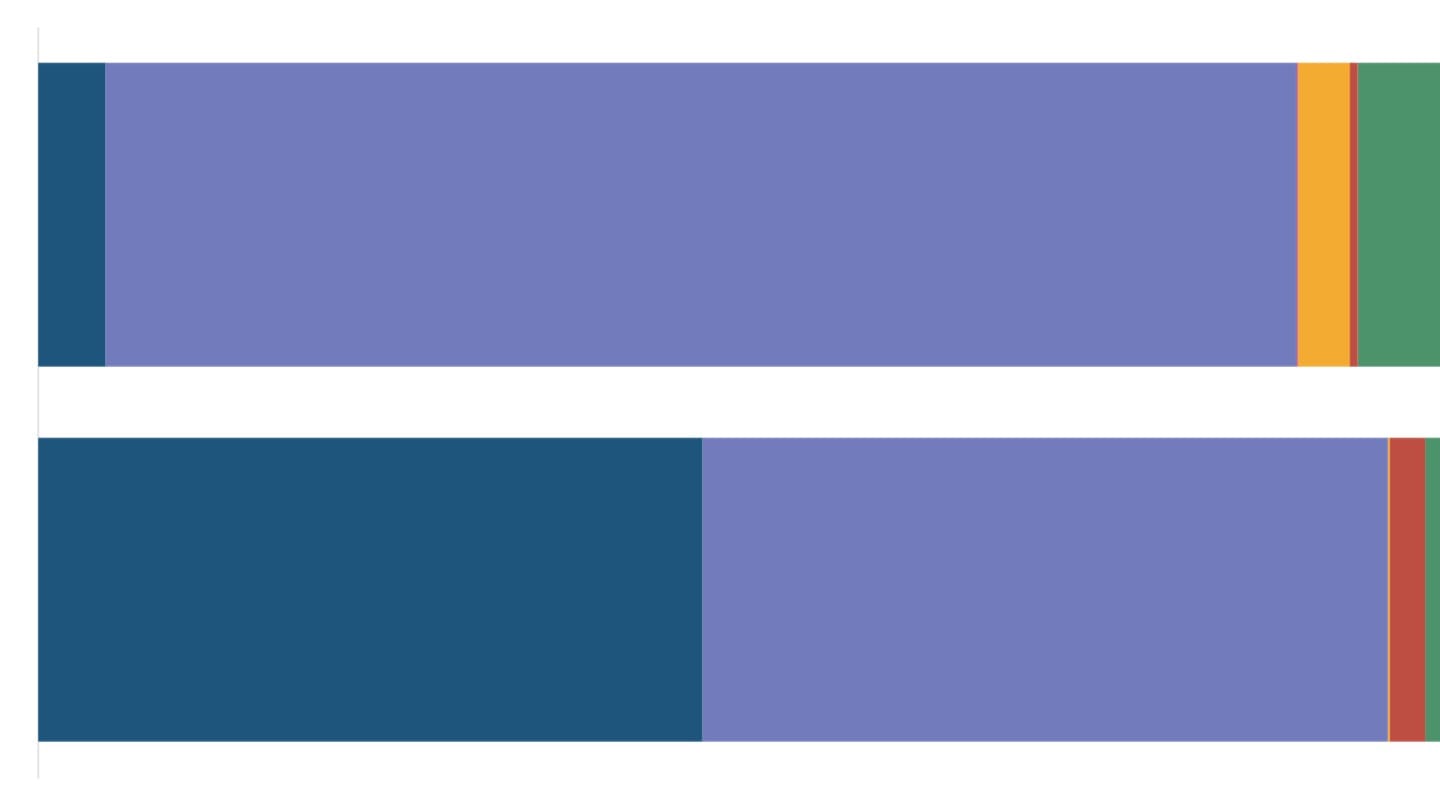
The NFHS is part of a global demographic survey system led by the United States Agency for International Development.[13] These surveys are collectively known as Demographic and Health Surveys (DHS). To check whether DHS surveys in other countries were also missing males, we compare the sex ratios of five countries with large populations for which DHS data and their national census data were available for the same year. In all of these countries, we find that sex ratios reported by DHS surveys were more female-skewed than those reported by their respective censuses.
We find the same trend when we compare sex ratios reported by the DHS with those estimated by the UN in its World Population Prospects (WPP) database. For most countries, DHS sex ratios are more female-skewed than those reported by the UN. Our analysis suggests a systemic female bias in DHS population counts across the globe. The over-representation of females in the NFHS is consistent with that pattern. While a few researchers have referred to the male undercount in DHS surveys[14] in their research papers[15], we were unable to locate any in-depth analysis of the reasons behind this bias.
Implications
Our analysis has shown a consistent female bias in the estimation of sex ratios in India's NFHS, and in DHS surveys more broadly. As a result, we suggest caution while comparing sex ratios reported by DHS surveys (such as the NFHS) with those reported by other sources (censuses or other surveys). For instance, using the sex ratio from the NFHS-V report in 2021 to suggest that India's sex ratio has improved sharply as compared to the Census would be premature.
Our analysis also suggests that DHS estimates of gender gaps across different parameters such as literacy or access to mobile phones need to be interpreted with caution.
[1] The latest round, conducted in 2019-21, surveyed over 600,00 households, 700,000 women and 100,000 men.
[2] Census estimates are not entirely free from error either. See for example the Registrar General of India's post-enumeration report on the extent of undercounting in the 2011 Census, and work by the economists Ankush Agrawal and Vikas Kumar on errors in Census estimates of the population of the states of Nagaland and Manipur.
[3] The interpolation method uses data from two known points (for example, census years) to approximate values for intermediate (inter-censal) years. In this analysis, we used a compounded rate formula to calculate the sex ratios for the years pertaining to the NFHS rounds (1993, 1999, and 2006).
[4] We compared the projected sex ratios for India and major states from the RGI's 1996 population projections report with the census figures for 2001 and 2011. The projections for India as a whole exactly matched the census figures, while for most major states, the absolute difference between the projected and census sex ratios was less than 20 females per 1,000 males. Similarly, we analysed the 2006 RGI population projections against the 2011 census and observed a close alignment, with absolute deviations for most major states staying below 20 females per 1,000 males. Hence, the RGI projections can be considered to be a reasonable benchmark when it comes to sex ratios.
[5] A 2019 United Nations Population Fund report indicates that NFHS-based estimates of the sex ratio at birth are much closer to census estimates compared to those from the RGI's Civil and Sample Registration Systems (CRS and SRS).
[6] Collective living arrangements such as hostels, army camps, boarding schools, or prisons are not considered as households in NFHS. - NFHS-5 Interviewer's Manual (2019), International Institute for Population Science, Mumbai
[7] According to the Census, a group of unrelated persons who live in an institution and take their meals from a common kitchen is called an 'Institutional Household'. Examples include hostels, hotels, jails, old age homes and orphanages.
[8] Each individual inmate (including residential staff) of a mess, hotel (excluding temporary inmates), boarding and lodging house, hostel, etc. constitutes a 'single- member household'. - Concepts and Definitions Used in NSS (2001), National Sample Survey Organisation.
[9] If the census sex ratio were to be recomputed by excluding the institutional and houseless population, the gap narrows slightly. For instance, the 1991 census estimate would increase marginally from 927 to 933 if the institutional and homeless population are excluded. This is still substantially lower than the sex ratio of 957 reported by NFHS-1.
[10] NFHS, like other DHS surveys, provides the de facto sex ratio, counting males and females who stayed in the selected households the night before the interview, whether they are usual residents or visitors. The Indian census also provides de facto population figures.
[11] The NFHS-1 (1992-93) India Report said: "It seems highly unlikely that the NFHS missed more males than females because the under-enumeration of females is typically more common in India… Moreover, training and supervision of interviewers were much more thorough in the NFHS than in the census. Therefore, the most likely source of the discrepancy in the estimated sex ratio is the relative under-enumeration of females in the 1991 census."
[12] Comparing the 1991 census and NFHS-1 (1992-93) data with his modelled estimates (EPW, 2002), the demographer P. Bhat suggested that the 1991 census may have overcounted women aged 15-34 while undercounting elderly women. These errors, he suggested, cancelled each other out, leaving the overall sex ratio unaffected. In contrast, the overestimation of women in the 15-34 age group in NFHS was much larger and wasn't offset by the underestimation of older women, making the overall sex ratio female-biased. Because women of reproductive ages were of particular interest in the NFHS, it is possible that households with no married women were undercounted in the survey, Bhat wrote.
[13] All NFHS rounds were conducted under the the Union Ministry of Health and Family Welfare in India, with the International Institute for Population Science (IIPS), Mumbai as the nodal agency and technical support from USAID through the DHS Program.
[14] A comparison of census and DHS sex ratios for the 15-49 age group across eight African countries shows DHS sex ratios to be female-biased, indicating that the surveys are missing males of that age group.
[15] Gender- related data missingness, imbalance and bias in global health surveys (2019), BMJ Global Health