The periodic labour force survey (PLFS) is one of India's most widely used data sources on employment. The findings of the 2022-23 and 2023-24 rounds of the PLFS were unusual for at least three reasons - one, Assam's population estimate appeared to increase dramatically in 2022-23, before returning to its expected level in 2023-24. Second, Assam's worker-population ratio (WPR) and other demographic characteristics appeared to see unexpected changes in 2022-23 followed by a return to usual levels in 2023-24. Finally, the all-India sex ratio figure (females per 1000 males) appeared to fall in 2022-23, followed by a revival in 2023-24.
Our research finds that a mistake in the 2022-23 PLFS sampling process - an erroneously large weight assigned to one village in Assam - led to a series of cascading effects on the data for that village, the district it belonged to, the state of Assam and the country as a whole. Our findings suggest that PLFS data for these two years needs to be used with caution, ideally without the problematic village.
Understanding the PLFS survey methodology
Conducted by India's National Statistics Office (NSO) since 2017, the PLFS is a nationally representative survey designed to estimate key employment and unemployment indicators across India and its states. It employs a stratified multi-stage sampling design, dividing states into regions, which are further classified into urban and rural areas. The first stage units (FSUs) for sampling are Urban Frame Survey (UFS) blocks for urban areas and 2011 Census villages for rural areas. FSUs are selected using the probability proportional to size (PPS) sampling method. Eight households per FSU are then selected using simple random sampling to ensure a representative distribution.
As in other large-scale surveys, weights or multipliers are used to make the sample representative of the entire population. Each sampled unit (village/ urban block or household) in a sample survey represents not just itself but a group of other units in the population; a sampled household, for example, is meant to represent a number of similar households in that village. The final weight assigned to a sampling unit represents the total number of units in the population that unit is supposed to represent.[1]
The Assam error
In the 2022-23 PLFS, three villages or FSUs in Assam's South Salmara-Mankachar district[2] were among the 327 rural FSUs surveyed in the state and the 6,982 rural FSUs surveyed in the country. Through an error, one of the three FSUs - number 10386[3] - was assigned a weight 650 times the average weight assigned to other FSUs in the district.
A senior official from NSO's household survey division confirmed the error to DFI. The problem[4] was detected by the NSO, but only after the PLFS report for that year had been released. It has not yet been corrected in the PLFS documentation.
As a result of this error, South Salmara-Mankachar district's population and, in turn, Assam's population, got significantly inflated in the PLFS estimates. The unusual characteristics of that single village, given its outsize weight, also skewed workforce and demographic estimates for the district, state and country.
Implications
Population
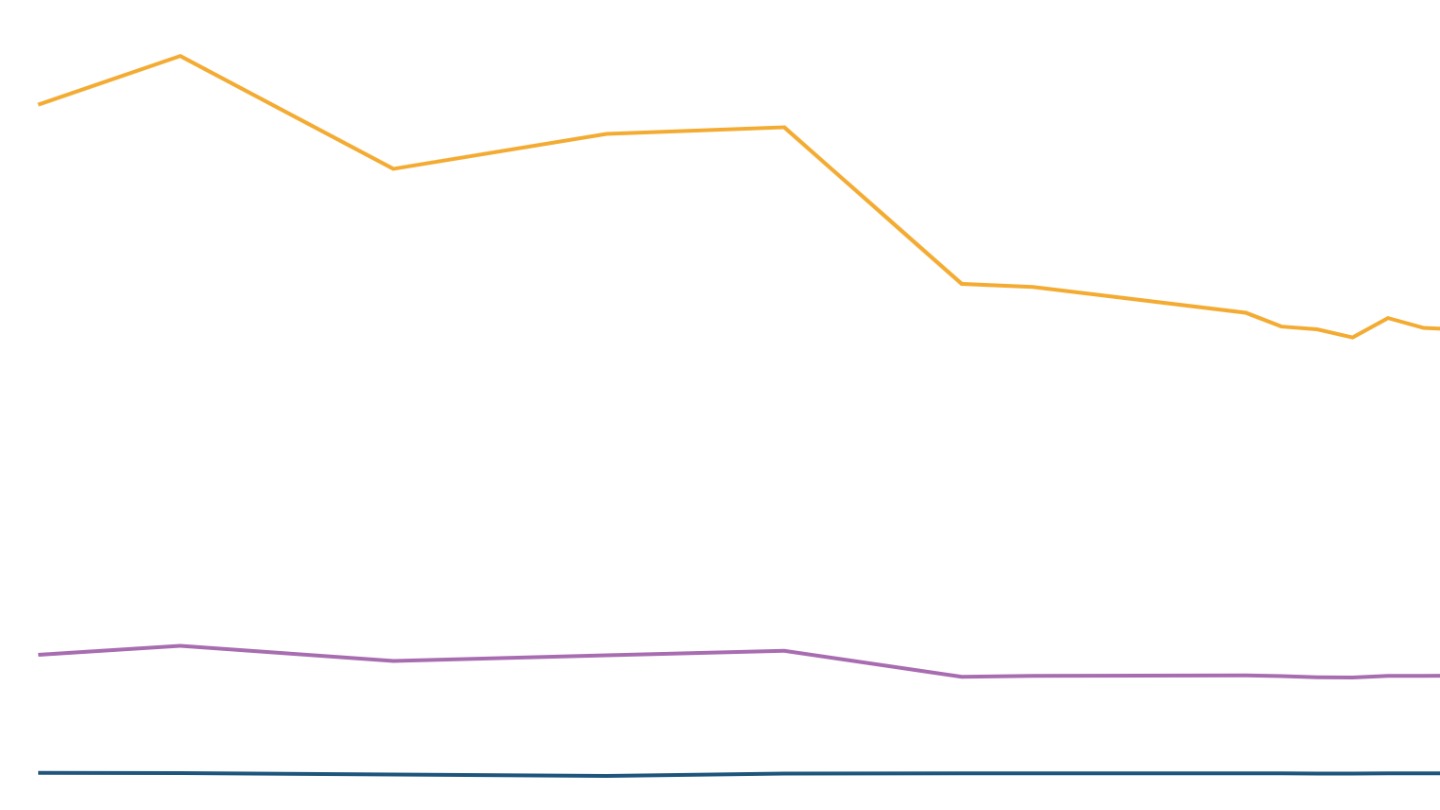
Population estimates from NSO surveys for major states (those with 10 million plus population) tend to be similar for surveys conducted close to each other. For major states, year-on-year fluctuations in population estimates reported by PLFS tend to be within the +/- 10% range. Assam is the only exception that saw much higher fluctuations in the recent rounds.
As a result of the weighting error, South Salmara-Mankachar's population got inflated to 61 million people for 2022-23 and Assam's estimated population appeared to shoot up to 94 million, roughly triple that of the previous year (2021-22). The next year (2023-24), PLFS once again reported Assam's population estimate to be 33 million, seeming to suggest a severe contraction in the state's population. In effect, it was 'correcting' the erroneous 2022-23 spike.
Workforce estimates
The erroneous weight assigned to FSU 10386 also affected estimates of the size of Assam's workforce. Since the village had very few working females and a high proportion of children, it deflated the state's WPR (worker-population ratio, or the ratio of workers to the total population) in 2022-23.
We could use the survey data to estimate the total size of the workforce in two different ways. One way is to treat the weighted number of workers available from the survey as the workforce ("direct method"). The other way, recommended by the National Statistics Office[5], is to use the WPR from the PLFS, and to multiply it by the Registrar General of India's (RGI) population projections to arrive at the total number of workers in the country ("indirect method").
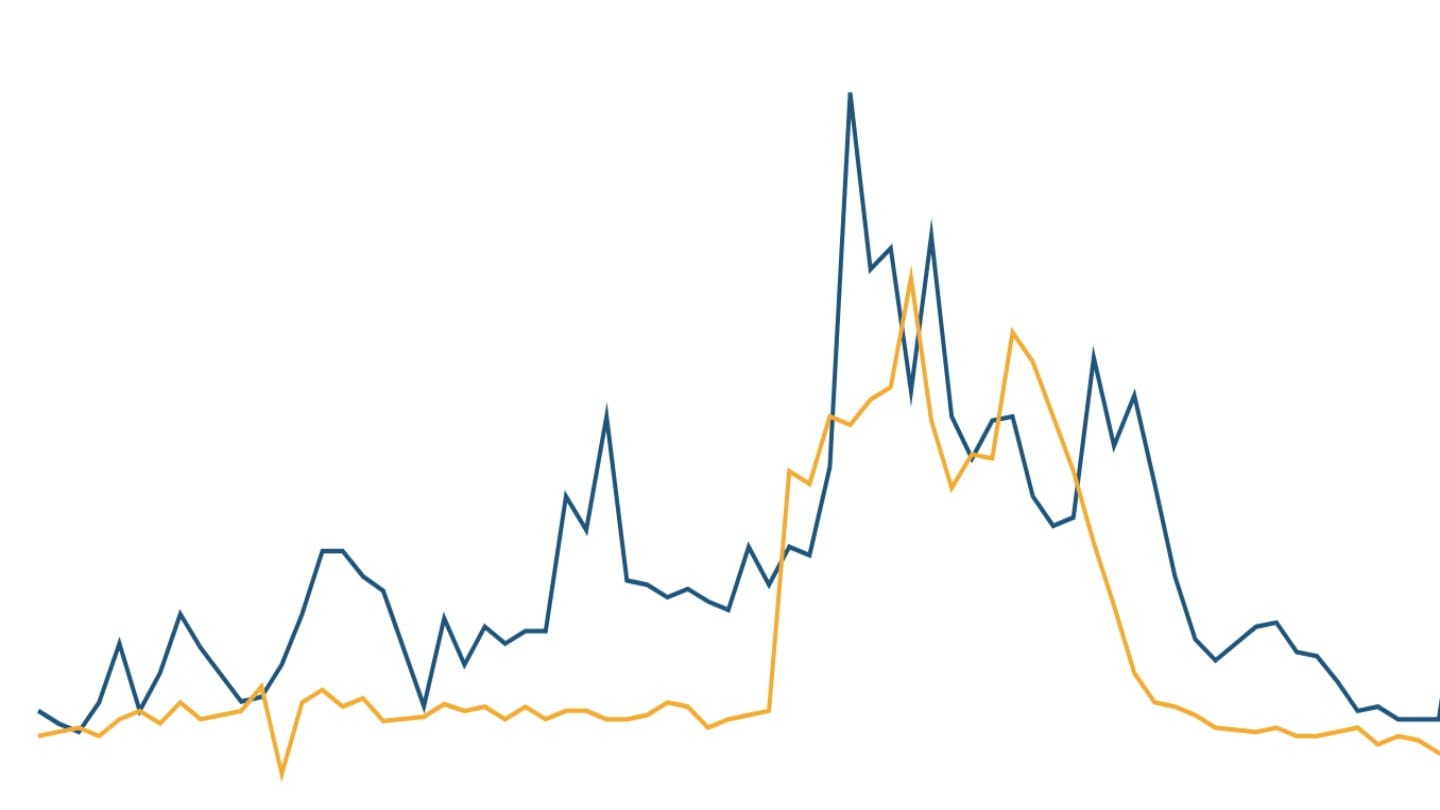
While workforce estimates computed using the two methods tend to differ in magnitude, they typically move in the same direction. But Assam's workforce numbers show diametrically opposite trends depending on which method we use.
If we use the direct method, Assam's workforce numbers more than double from 12.3 million in 2021-22 to 28.4 million in 2022-23, before dropping to 15.7 million people in 2023-24, since it relies on the inflated number of total workers reported by PLFS.
If we use the indirect method, Assam's workforce estimates fall from 13.3 million in 2021-22 to 10.8 million in 2022-23, and then rise to nearly 17 million in 2023-24, since it relies on population counts from RGI's projections.
If we leave out the 2022-23 data, both methods suggest a rise in Assam's workforce between 2021-22 and 2023-24, showing that the inflated population estimates and the deflated WPR for 2022-23 caused the break.
Demographics
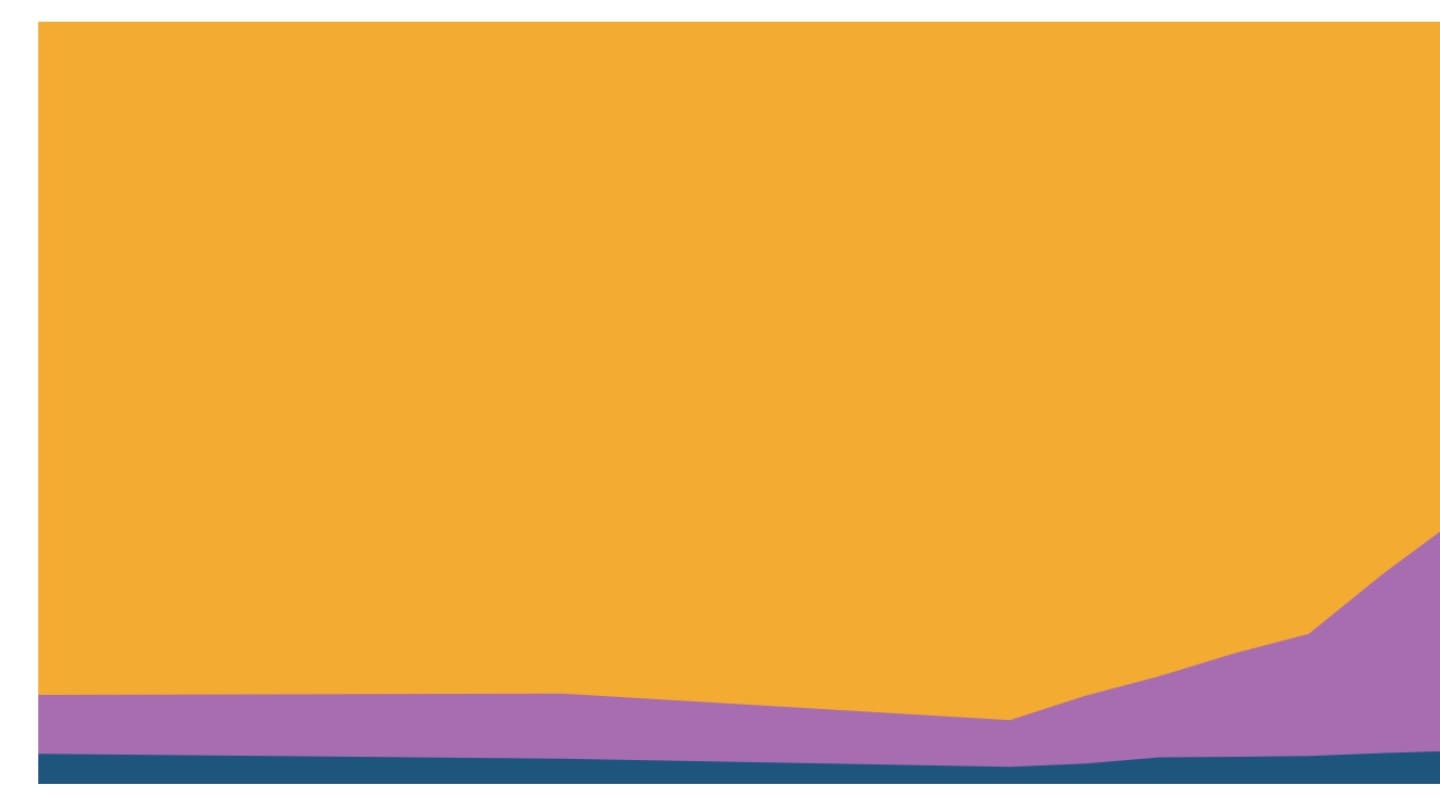
Given the huge weight assigned to FSU 10386, it distorted other demographic parameters of the state as well. Since FSU 10386 contained more males than females, it skewed the overall sex ratio of the state. Since there were no SCs or STs in that FSU, it also pulled down the overall share of SCs and STs in the state.
The erroneous weighting also distorted the all-India estimates. Since FSU 10386 contained more males than females, affecting Assam's sex ratio in 2022-23, it also resulted in a seeming drop in the all-India sex ratio figure (females per 1000 males) that year, followed by a 'correction' in 2023-24.
The way forward
To attempt to correct for this error, we remove the problematic FSU in 2022-23 and recalculate the values.[6] Removing one FSU does not impair the precision[7] of the state-wide estimates.
Once we recompute the estimates after excluding the FSU, the rise in Assam's population and workforce numbers follows a steady and modest increase over the 2021-22 to 2023-24 period.
Similarly, India's population and workforce estimates show a steady increase, instead of the sharp jump seen without the adjustment.
The fluctuations in Assam's sex ratio also get ironed out once we exclude FSU 10386 to recompute the estimates. India's sex ratio also appears far more stable once this FSU is excluded.
Our analysis suggests that the all-India workforce estimates (and other demographic parameters) should be recomputed by excluding the problematic FSU. Using the 2022-23 data without this adjustment would lead to erroneous conclusions.
[1] For example, if the probability of a household being selected in the survey is 1 in 600, then the household would have a weight of 600, meaning it represents 600 households in the entire population. This weighting ensures that the survey results remain representative of the population.
[2] The PLFS documents do not provide the names of the districts. We identified the district name by matching the provided district codes with their corresponding names from the Comprehensive Annual Modular Survey (CAMS), conducted by NSO in the same year as PLFS 2022-23.
[3] While the National Statistics Office (NSO) does not provide the names of sampled villages or urban blocks, it assigns a unique identifier to each FSU. This one was numbered 10386.
[4] Many national surveys, including the PLFS, select villages or urban blocks based on the probability proportional to size (PPS) method. Under this approach, villages with higher populations have a higher chance (or probability) of being selected. The weights assigned to villages are inversely related to the population size, and hence larger villages are assigned smaller weights. Smaller villages have a lower probability of being selected under this method, and have a higher weight attached to them.
Villages which were uninhabited or depopulated as per the last census (but which may contain some inhabitants currently) are assigned a nominal population level of 1. This ensures that such villages are included in the selection process but have a very low probability of being selected. However, if such a village does get selected, it would carry a very high weight (inversely proportional to the probability of being selected). According to the NSO official cited here, FSU 10386 was one such village that was uninhabited at the time of the 2011 Census, got picked this time, was found to be inhabited, and ended up with an abnormally large weight.
[5] The NSO has advised data users to rely on the indirect method of estimation since estimates of the total number of people (and hence total number of workers) tend to be undercounts in its surveys. For instance, see "Review of Concepts and Measurement Techniques in Employment and Unemployment Surveys of NSSO", NSO (SDRD) Occasional Paper/1/2008.
[6] We use the indirect method here, combining RGI population estimates with PLFS WPR estimates to compute workforce estimates.
[7] Precision here refers to the relative standard errors of the estimates. Survey estimates with low relative standard errors have lower variability and are considered more reliable or precise.