India is one of the world's biggest economies. However, economic activity is not uniformly spread throughout the country. Among India's 28 states and eight union territories, there are significant differences in economic size and other economic characteristics such as the sectoral composition of the economy, as well as in their relative affluence and trajectories of economic development.
Economic size and relative affluence
State economies are measured using net state domestic product (NSDP), similar to the gross domestic product (GDP) at the national level.[1] The NSDP is the gross state domestic product minus the depreciation in the value of fixed assets such as machinery.
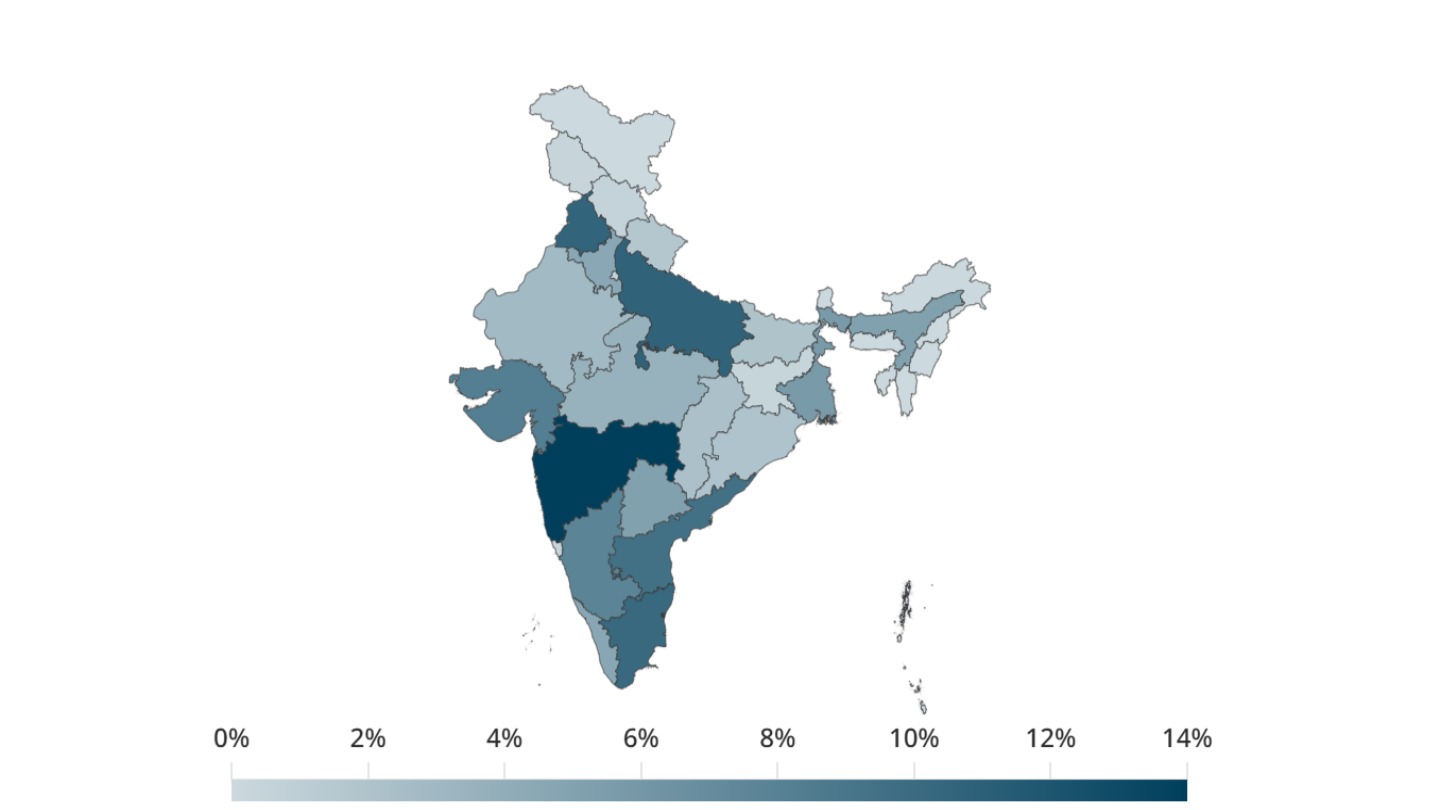
India's southern and western states have the largest NSDPs, even though they are not the largest states in terms of population. These seven states - Gujarat, Maharashtra, Karnataka, Kerala, Tamil Nadu, Andhra Pradesh and Telangana - are home to a third of India's population but contribute to more than half of the country's total economic output.
Maharashtra is India's biggest state in terms of economic size, with an NSDP of ₹32 trillion (roughly $400 billion in 2022-23). Maharashtra's economic size would be similar to that of Denmark or Malaysia in 2023; if it were a country, its GDP would be between the 35th and the 40th largest in the world.[2]
The next four biggest states in economic terms - Gujarat, Tamil Nadu, Karnataka and Uttar Pradesh - each have an economy nearing a size of ₹20 trillion ($250 billion), similar to the GDP of New Zealand or Greece in that year.
The NSDP of a state is by itself not a complete measure of how rich the state is. Uttar Pradesh and Rajasthan are among the biggest economies in the country, for instance, but this is in part a result of their large population sizes.
To be better able to compare the economies of states with different population sizes, we look at the per capita income, measured by dividing the NSDP of a state by its population. The per capita NSDP gives a better sense of the relative affluence of states.
India's average per capita income was a little less than ₹200,000 ($2,500) as of 2022-23.[3] Among India's large states, Karnataka and Telangana had the highest per capita incomes (₹350,000 or $4,300).[4] Their per capita incomes in 2023 were similar to that of Viet Nam. Bihar was the poorest large state with a per capita income close to ₹60,000 ($750), about equal to that of Sudan.
Neither the GDP, nor the per capita GDP directly measure how much people live on. That is best understood through household surveys that capture consumption, as we've written about here.
Economic growth among states
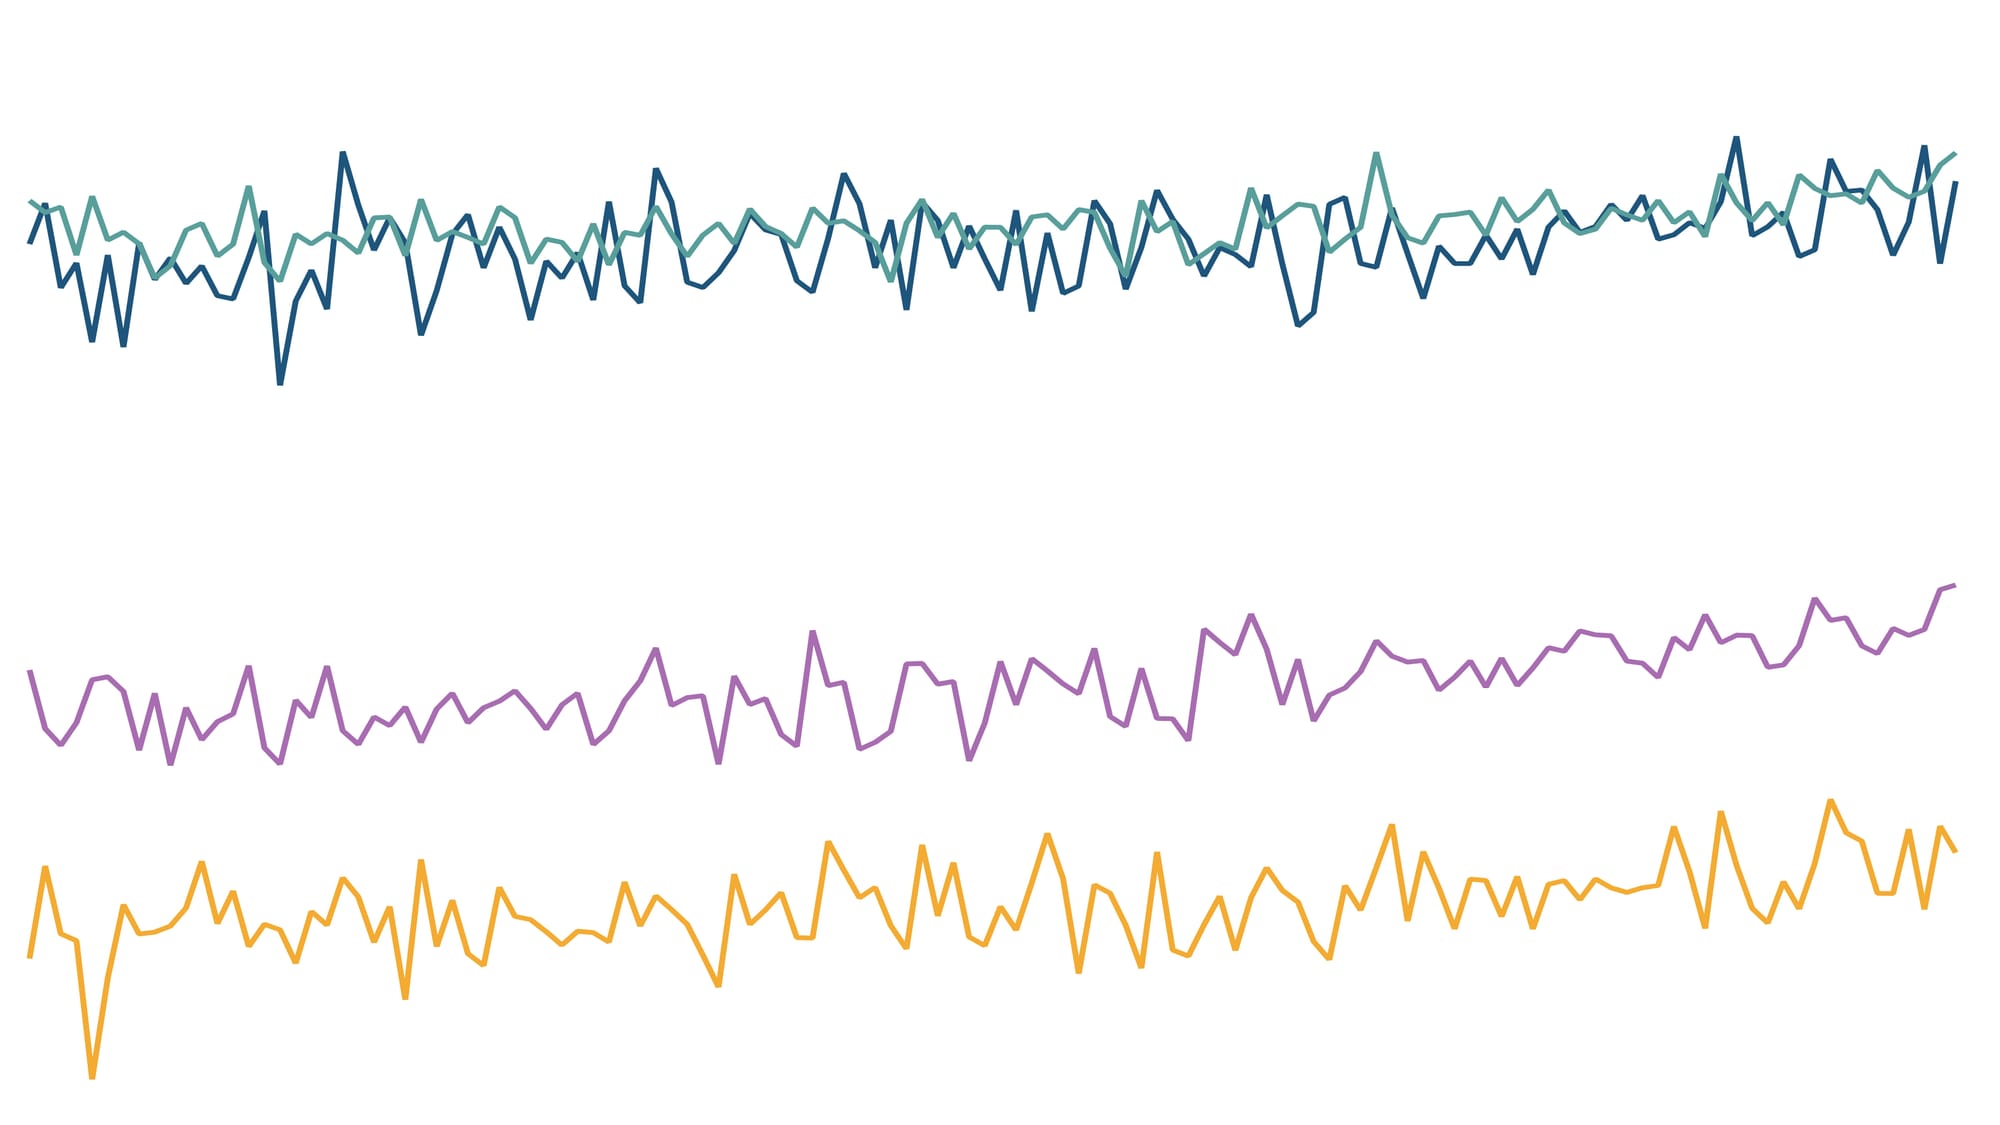
While all Indian state economies are growing over time, the pace of growth varies among them.[5] The richer states have grown faster, accounting for a growing share of the total GDP, while the poorer states have grown slower, making up an even smaller slice of the total economy. This has led to a divergence between India's richest and poorest states - instead of the poorest states catching up to the richest states, they are growing further apart.[6]
The five southern states - Karnataka, Kerala, Tamil Nadu, Andhra Pradesh and Telangana - now contribute considerably more to the national economy than before.[7] In four decades, their share in the national GDP has increased from 23% to 31%. The contribution to national GDP of the economies of the four eastern states - Bihar, Jharkhand, Odisha and West Bengal - meanwhile has dropped from 18% to 13% over the same period, despite both regions having comparable populations.
In per capita terms, this divergence becomes even sharper, because the richer states are also the ones where population growth has slowed much more dramatically.
In 1981, for instance, West Bengal's per capita income was 16% higher than Karnataka's. In 2021, Karnataka's per capita income was 111% higher than that of West Bengal, showing a reversal of positions, and the widening of the gap between one of the richest and one of the poorest states in India.[8]
Sectoral composition of state economies
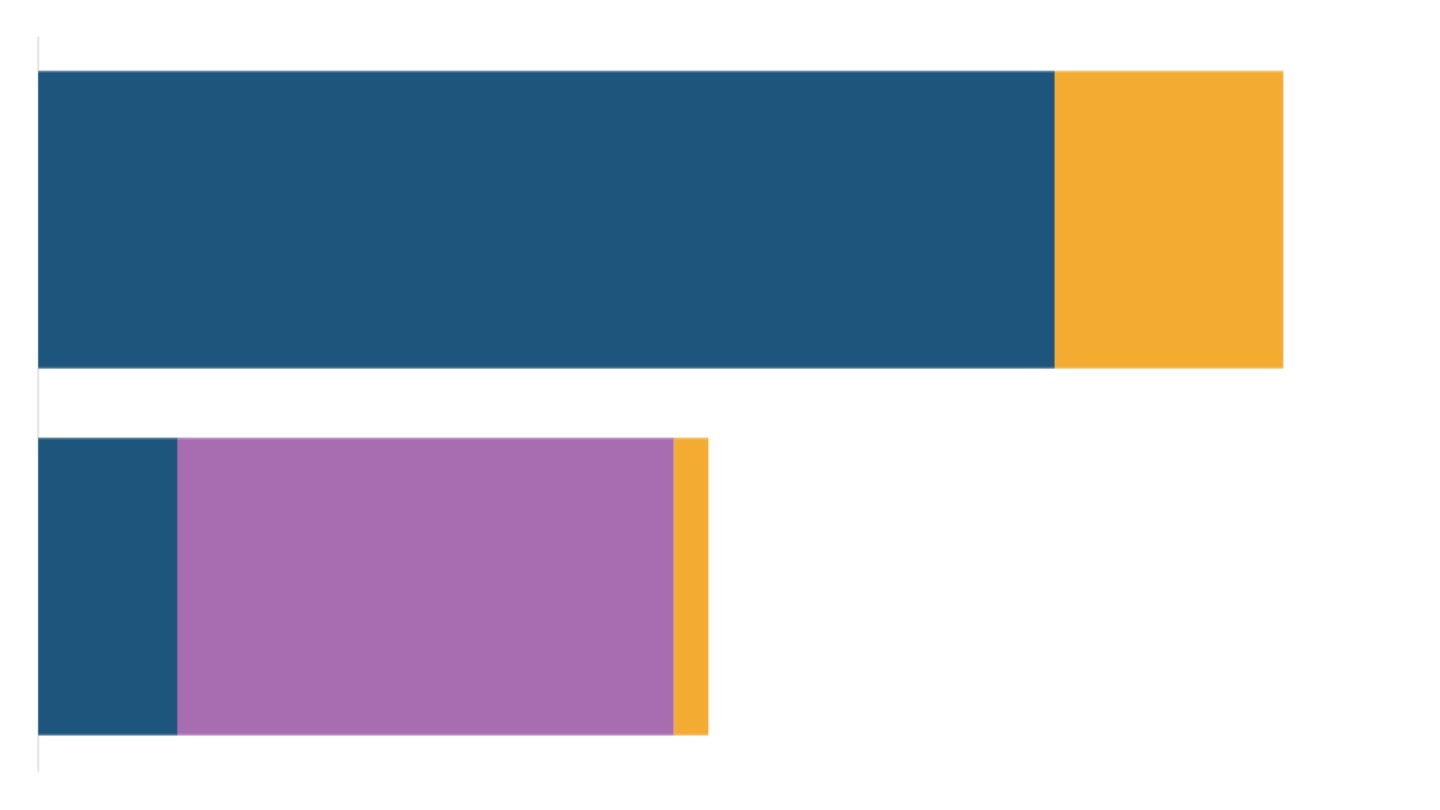
In macroeconomic terms, a country or state's economy is usually classified into three broad sectors - agriculture, industry[9] and services. Over time, the Indian economy has steadily moved away from its dependence on agriculture, with services now accounting for the largest share of GDP - 55% as of 2024.
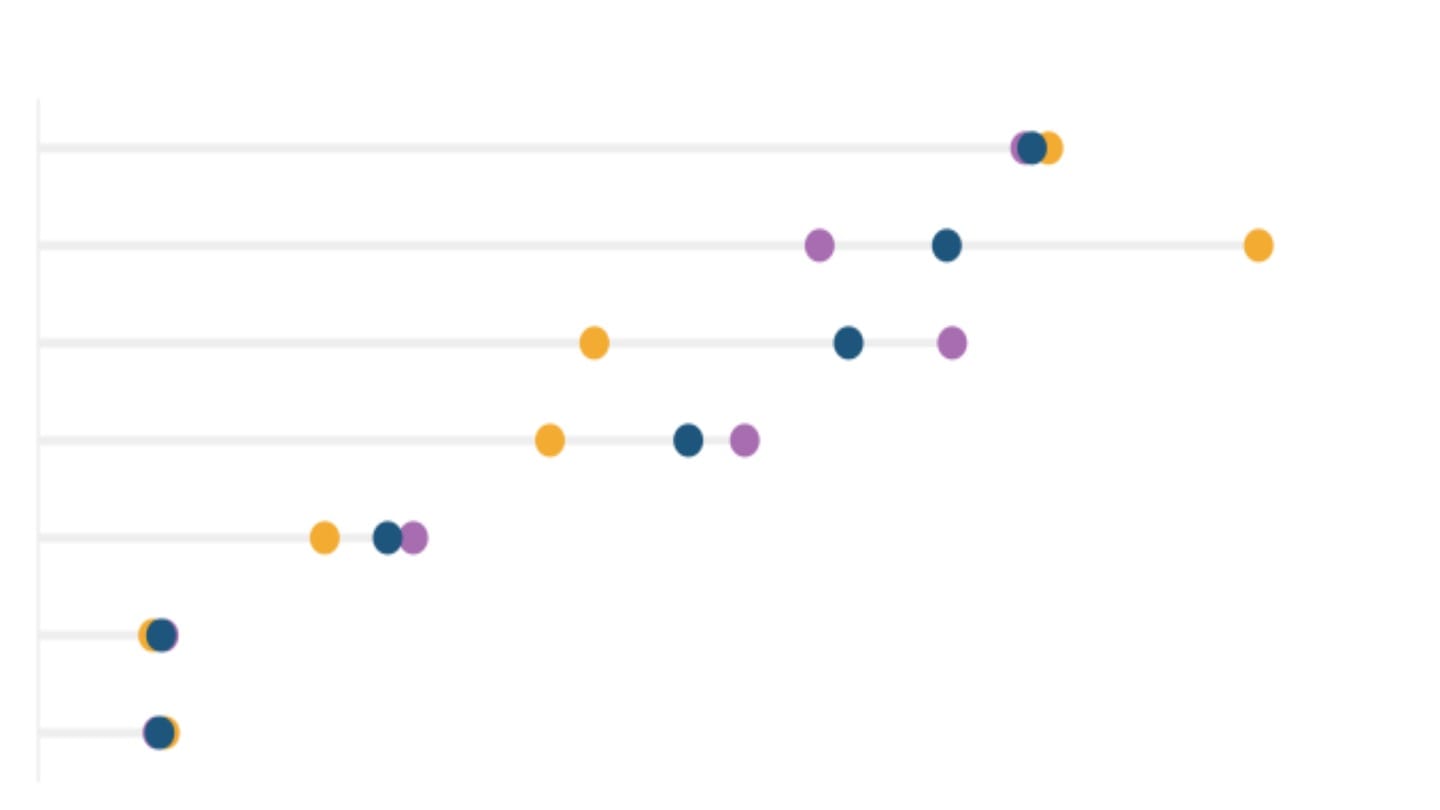
To varying extents, most Indian states too reflect this broad shift. For the most part, India's richest states are the ones where agriculture now accounts for the smallest share of the state's domestic product. In states like Kerala and Karnataka, services contribute more than 60% of the state's GDP.
Gujarat is unusual among richer states, with its manufacturing sector a much larger contributor to its economy than its services sector. Among richer states, Punjab is an outlier in still seeing a large contribution of agriculture to its economy.
[1] The NSDP and GSDP can be used interchangeably to understand the economic sizes of states, if we use the same indicator for all states. We source the data from the Database on Indian Economy (RBI), which provides data on NSDP. The original source of the data is the Ministry of Statistics and Programme Implementation.
[2] Here, the nominal GSDP of Maharashtra is converted to US dollars at the exchange rate prevailing in that year (2022-23), and is compared with the nominal GDP in US dollars for countries for 2023, per the International Monetary Fund's World Economic Outlook.
[3] First revised estimate of per capita GDP for 2022-23 in the old GDP series with base 2011-12.
[4] Although Goa and Sikkim have the highest per capita incomes in the country, this analysis looks at large states only. Large states are defined as those with a population of more than 10 million in 2023 according to official projections.
[5] State domestic product data is available from the 1970s, but not in a uniform and comparable time series. Every few years, a new and better methodology replaces the older one, similar to the rebasing of the national accounts series. Unlike in the case of the national accounts series, there is no official linking factor for states that could be used to compute a consistent time series. Since it is difficult to compare growth rates across different time series, we look at the state's share in the sum total of domestic products of all states (at current prices) as a measure of its economic standing, and compare that over time. For any year, if the data is available from more than one domestic product series, DFI uses data from the newest series.
[6] To measure for convergence/ divergence, we calculate the coefficient of variation among states' per capita incomes, and find that it has gradually risen from 1981 to 2021. This means that the income gap between states has widened over time.
[7] The grouping of states is done in the same way as the National Family Health Survey. Southern states: Tamil Nadu, Karnataka, Kerala, Andhra Pradesh and Telangana. Eastern states: Bihar, Jharkhand, Odisha and West Bengal. The data accounts for the reorganisation of states.
[8] This concept of relative per capita income has been borrowed from the publication EAC-PM/WP/31/2024 from the Working Paper Series by the Economic Advisory Council to the Prime Minister (EAC-PM).
[9] Industry includes mining, manufacturing, construction and utilities such as electricity and water providers.