Trade
Software service exports in particular have transformed the nature of international trade between India and the world.
One of the most important ways that countries interact with each other in the global economy is through trade - imports into the country and exports out of the country. Imports and exports are usually measured in US dollar terms for two reasons: the US dollar is the currency most widely used in global trade, and it makes comparisons among countries easier.[1]
Imports and exports
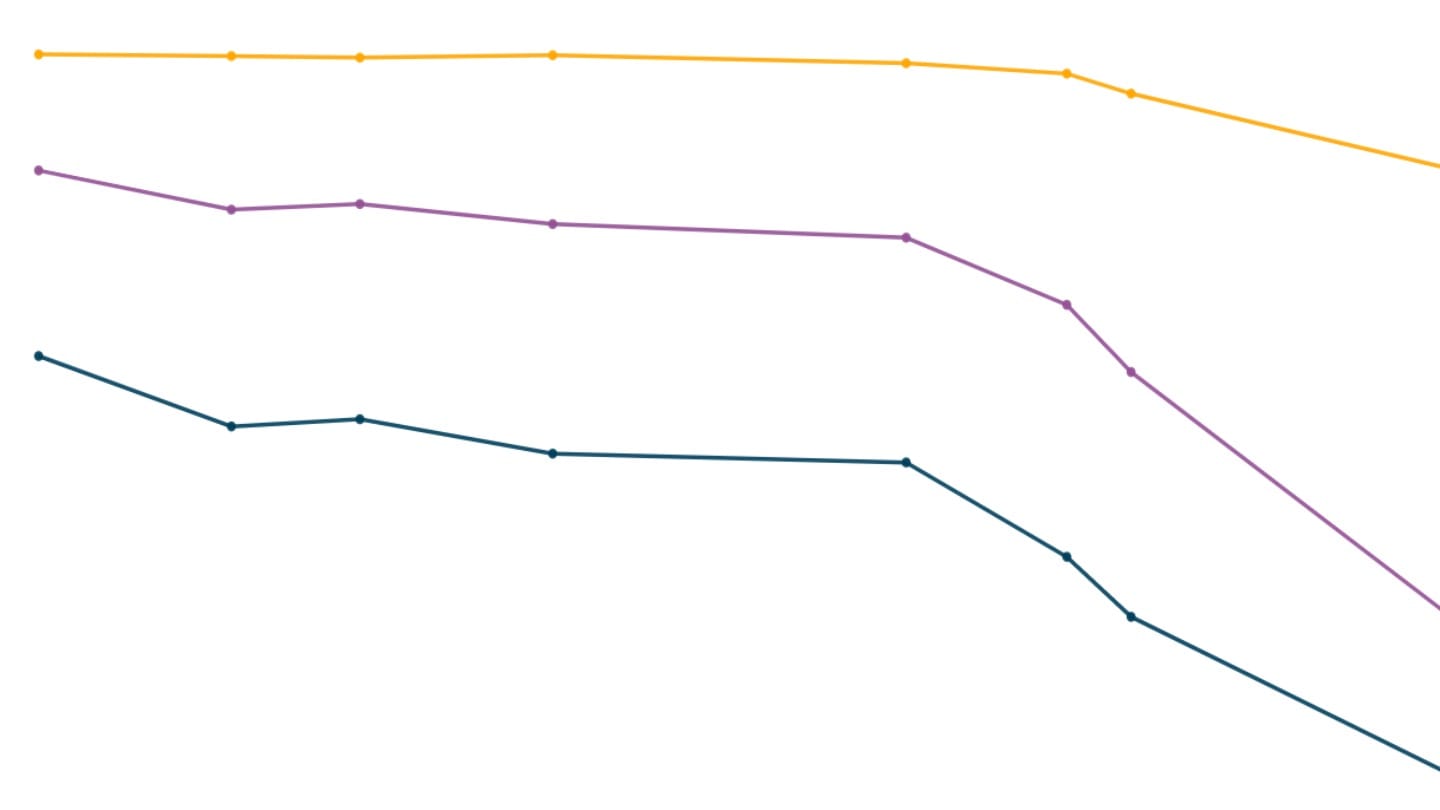
Countries import and export goods and services from and to each other. The total value of the goods and services that India imports has been higher than the value of the goods and services it exports in recent decades. Today, India imports goods and services worth $850 billion, while its exports add up to $780 billion.[2]
Global trade witnessed a sharp rise in the 2000s - in India too, trade with the world picked up from the 2000s, a period during which India's imports grew at a sharper rate than exports. That boom was cut short by the Global Financial Crisis in 2008-09.[3]
The sharp post-2020 spike in trade is as a result of two key reasons. First, the COVID-19 pandemic hit trade across the world as a result of restrictions on mobility, and a fall in demand for goods and services. Low demand also reduced the international prices of goods and services. As the restrictions were lifted, pent-up demand revived trade between countries, brought inflation (price rise) with it, and trade soared to record highs in 2022 and 2023.[4] Secondly, international oil prices rose sharply as a result of global events.[5]
India's imports
Broadly, trade is made up of trade in goods and services.[6] In India, imports are dominated by goods (or merchandise).
Goods imports
One product group in particular dominates India's imports - coal and petroleum crude form nearly one-third of the goods India imports by value and were worth more than $220 billion in 2023. This is because the Indian economy is heavily dependent on petroleum crude oil imports; only 10% of petroleum crude oil that India requires is actually domestically produced, while ninety percent of the requirement is met through imports.[7]
Gold and precious stones are India's next most important imports, but their absolute value as well as their relative share in total imports has fallen over the last decade.[8] While gold imports primarily represent consumption or use by citizens, imports of gemstones are mainly done to manufacture and export finished jewellery.
Mechanical and electrical machinery form the next biggest parts of India's import mix. India imports electronic integrated circuits, including semiconductor chips (worth more than $20 billion in 2023-24), smartphone parts such as displays and communication equipment such as routers (worth more than $15 billion), and devices such as laptops ($10 billion).[9]
Services imports
Business services and transportation are the services India imports the most. Business services include legal services, accounting and management consulting, and residual services not included in travel, transport, software, financial services, insurance, communication and construction. Their imports were valued at $60 billion in 2023-24.
Transport trade includes passenger and freight transport services through land, water and air provided by residents of one country to residents of another.
India also imports around $20 billion worth of software.
India's exports
While goods also form the majority of Indian exports, there has been a steady increase in the relative share of services in exports.
Goods exports
A recurring theme in India's trade, like many other countries in their emerging economy stage such as China and Vietnam, is the import of raw material and intermediate goods, and the export of finished products using these raw materials. For instance, India imports crude oil which is then processed by government-owned and private corporation-owned refineries, to produce end products like diesel and airline fuel. These are then retailed out domestically at fuel stations, and a big portion is exported to countries around the world. India also domestically manufactures as well as imports parts that go into the smartphone - such as batteries and displays - and exports finished smartphones. Another example is the import of gemstones and the export of gem-studded jewellery.
Similar to its role in goods imports, petroleum also forms the biggest component of India's exports, but in the form of products such as diesel, airline fuel, and petrol/gasoline. Compared to coal and petroleum crude imports of $220 billion, India's petroleum product exports amounted to less than $90 billion in 2024.[10]
As with imports, machinery and electronic goods including fully assembled smartphones, machine parts, and engines are a big part of India's exports.[11] India exported smartphones worth nearly $16 billion 2023-24.[12]
Services exports
Over the last few years, growth in services exports has outstripped growth in the export of goods, driven largely by India's expanding software services export market. Software exports are in particular driving this boom. Software or Information and Communication Technology (ICT) service exports of India amounted to $150 billion in 2022-23, making it the biggest category in India's export mix, outdoing even petroleum products.[13] Software services include designing and deployment of software and hardware, broadcast of news and information, repair of hardware and servers, and maintenance of databases among others.[14]
India provides about 13% of global ICT service exports.[15] Business services, that mainly include legal, accounting and management consulting, contribute to one-fourth of services exports. Both software as well as business services exports have grown nearly 15x over the last two decades.
India's trade relative to its economic size
The value of a country's trade in relation to its economic size can be one important indicator of the degree of openness of that economy. One indicator that is often used to understand the economic strategy of different countries is the trade to Gross Domestic Product (GDP) ratio. Here, all of a country's trade - both its imports and its exports, are added up, and are expressed as a percentage relative to the country's GDP. India's trade to gross domestic product ratio is around 45% - comprising exports at 22% relative to GDP, and imports at 24% relative to GDP.
India's trade relative to economic size has moved in a pattern similar to China's. However, some countries are far more tied into international markets. Trade plays a much bigger role in Vietnam's economy than India or China, or even the US or the world average. Vietnam's imports and exports are nearly as large as its GDP.
Trade deficits
The situation when imports are higher than exports is termed as trade deficit in economic terms. India's overall trade deficit is made up of a deficit in goods trade and a surplus in services. India imports services worth $180 billion and exports $340 billion in services (2023-24). On the other hand, India imports goods worth $680 billion and exports goods worth $440 billion. The deficit in goods trade ($240 billion) is partially offset by the surplus in services ($160 billion).
The overall trade deficit in 2023-24 was close to $80 billion. Relative to its economic size, India's trade deficit is between 2% and 3% of GDP. For most of the last decades, the trade deficit was near 2% of GDP. In the aftermath of the Global Financial Crisis, it increased to above 6%.[16]
Trade deficits are not necessarily a bad thing for an economy - what matters is what is causing the deficit or surplus and the reasons could be very specific to the country in question. The United States, the world's biggest economy, runs a trade deficit of more than $900 billion. Some lower middle income countries such as Bangladesh and Kenya, and high income countries like France also run a trade deficit.
China exports more than it imports, and runs a trade surplus, similar to Germany, Vietnam and Indonesia. India has the highest trade deficit among lower middle income countries, while China has the highest trade surplus among upper middle income countries.[17]
Developing countries generally have a limited pool of domestic savings.[18] In any economy, savings are the primary pool available for investments in capital assets such as factories, roads and buildings. With low incomes, savings in developing countries are insufficient to finance these capital investments. To grow fast, developing countries need to invest more than what domestic savings have to offer.[19] They do it through imports which become integral to their economies.
India's trade partners
A combination of historical, economic and geo-political factors tend to drive global trading patterns. India's trade partnerships too reflect these global realities.
While trade is made up of both goods and services, the measurement of the value of international trade is far more straightforward when it comes to tangible goods. In the case of services, measurement is more complicated. For instance, an Indian student in the US taking a taxi is technically exporting transport services to India. Or, if a foreign-owned insurance company provides insurance to an Indian company, it is technically an import of insurance from that country to India, and so on.[20] As a result, disaggregated data on the international trade in services has many gaps and inconsistencies.[21] For this reason, Data For India is using goods trade data alone in this section.
India's biggest import partner when it comes to goods is China, from where India imports mainly machinery and capital goods that are used in factories for manufacturing. India's main goods imports from the Gulf countries (chiefly the UAE and Saudi Arabia), the US and Russia are crude oil.
While India imports goods valued at $100 billion from China, exports from India to China add up to a little more than $15 billion. This means that India has a large bilateral goods trade deficit with China.
The US is India's biggest goods export destination, followed by the UAE, the Netherlands, and China. India's exports to the US, valued at $78 billion, are far more than its imports from the US ($42 billion), meaning that India has a goods trade surplus with the US.
India is a relatively small contributor compared to the leading countries in global goods exports. China, the US and Germany contribute to a third of goods exports made in the world, while India contributed less than 2% of global goods exports in 2021. India's role is relatively more significant in goods imported by countries in the Middle East and Africa.
[1]The US dollar accounted for 96% of trade invoicing in the Americas, 74% in the Asia-Pacific region, 66% in Europe and 79% in the rest of the world.
[2] Data for financial year 2022-23. Data on merchandise trade is maintained by Directorate General of Commercial Intelligence and Statistics, Ministry of Commerce and Industry, and that on services trade is maintained by the Reserve Bank of India in the Balance of Payments statistics.
[3] The high growth in global trade in the 2000s is well-documented in research.
[4] Trade not just revived to pre-pandemic levels but crossed them due to strong demand catalysed by economic stimulus packages implemented by countries. See Global Trade Update reports by UNCTAD for details.
[5] Chiefly, the Russia-Ukraine war
[6] Data on merchandise or goods trade is maintained by using a common system of codes under the Harmonized System (HS), an international product nomenclature developed by the World Customs Organization (WCO). The system, which harmonises trade data by describing nearly 98% of goods traded in the world, is used by more than 200 countries, according to the WCO. It comprises more than 5000 commodity groups, each identified by a code, with 2-digit codes having the lowest granularity and 8-digit HS codes having the highest level of granularity.
For instance, the 2-digit HS code for gemstones and precious metals is 71. Diamonds are a product group under gemstones and precious metals, and their 4-digit HS code is 7102. Non-industrial diamonds are a category of diamonds with 6-digit HS code 710231.
While comparing products or product groups, Data For India compares them at the same level of granularity, using the same level of codes.
[7] Data for financial year 2022-23, reported in Monthly Ready Reckoner, March 2024, Petroleum Planning and Analysis Cell
[8] Except in the financial year 2023-24, when gold imports jumped 30%.
[9] In this paragraph, semiconductor chips refer to 4-digit HS code 8542 (monolithic integrated circuits), displays and routers refer to items under 4-digit HS code 8517. Laptops and computers refer to items that fall under 4-digit HS code 8471. Data is sourced from Export Import Data Bank (Annual), Ministry of Commerce and Industry and some of the descriptions are sourced from the Goods and Services Tax website.
[10] Petroleum refers to 2-digit HS code 27
[11] These descriptions are derived from the 6- and 8-digit codes in the Harmonised System
[12] Smartphones refer to 6-digit HS code 851713
[13] At the level of 2-digit HS code, petroleum products exports were valued at $100 billion that year.
[14] The International Monetary Fund's Balance of Payments Manual describes this category as Computer and Information Services.
[15] ICT Service Exports for the year 2021, World Development Indicators, World Bank
[16] Data for the trade deficit (2023-24) from the Ministry of Finance; GDP data from the Ministry of Statistics and Programme Implementation; exchange rate data from the Reserve Bank of India.
[17] Data for 2021, World Development Indicators, World Bank
[18] Household income is broadly divided into consumption and savings
[19] 'Do Current Account Deficits Matter?', Atish Ghosh and Uma Ramakrishnan, International Monetary Fund, 2006
[20] For more details, see the Manual on Statistics of International Trade in Services, United Nations Statistics Division
[21] Services trade data for India is captured mainly in the Balance of Payments statistics by the Reserve Bank of India. While it captures the types of services, data disaggregated at the level of trade partners is not released regularly. Data from the World Trade Organisation which maintains bilateral trade statistics in services. does not reconcile perfectly with RBI data on the value of trade by the type of service (such as software, business services, and transport).


