Household spending in India
Consumption expenditure, an important indicator of living standards, has risen steadily, and the share of spending on food has declined sharply
One of the most important ways to understand how families in India live is by looking at their household consumption expenditure - how much they spend in a month or year. This is particularly important in India, where government surveys do not directly capture income owing to the challenges posed in accurately capturing incomes in an economy that is largely informal, and significantly agricultural. As a result, consumption expenditure is the closest indicator we have to understand poverty and growth in living standards[1].
Since 1972, India's National Sample Survey Office (NSSO) has been conducting Household Consumption Expenditure Surveys every five years to record household spending in India [2]. The most recent survey was conducted in 2022-23 and published in 2024. The new survey has some significant differences in methodology from past surveys[3].
In these surveys, trained enumerators ask a large, representative sample of households about their consumption of over 500 items - from salt to cars - within reference periods ranging from a week to a year[4]. This includes basics such as food, clothing and shelter, to services like health and education, as well as consumer durables and household items and utilities. It also includes the quantity and value of some subsidies like free cereals[5]. Consumption expenditure captured through these surveys excludes income tax, insurance premium payments, purchase or construction of land and real estate, charity and gifts[6]. (A more detailed account of how India measures household consumption is here.)
Household and per capita expenditure
The most recent survey shows that the average Indian household spent a little under Rs 20,000 every month (USD 240 per month) on all goods and services as of 2022-23[7]. The survey finds that the average household has between four and five (4.27) people. By dividing household expenditure evenly across all members of a household, it finds that the average expenditure per person, called the Monthly Per Capita Consumption Expenditure (MPCE) is a little under Rs 5,000 or USD 60.
There is a considerable gap between urban and rural consumption expenditures. While the average person in rural India spends a little less than Rs 4,000 in a month, an urban Indian spends around Rs 6,500 on average, or 70% more.
What do Indians spend on
Consumption expenditure is broadly divided into food and non-food categories.
Nearly half of rural per-person spending is on food, as against less than 40% in urban areas. The bulk of this expenditure in both rural and urban areas is on processed foods, which include packaged food, beverages and purchased cooked meals, a substantial shift from the past, where raw cereals made up the bulk of food expenditure. In 2023, 10% of the average MPCE in India was on processed food.
Within non-food expenditure, conveyance and purchase of durable goods are the item groups that occupy the biggest share in MPCE. Conveyance includes spending on transport services such as buses, auto, airlines and others, in addition to that on petrol and diesel for personal vehicles.
Medical expenses that cover both hospitalisation and non-institutional spending such as that on medicines make up 7% of average rural MPCE and 6% of urban. Together, health and education take up more than 10% of average per-person monthly spending in India.
Rent is a notable expense item only in urban areas, since rental living is common in cities but uncommon in villages. About 7% of average urban MPCE in India is on rent.
Socioeconomic disparities
National averages in a country India's size do not capture the variations that exist between different groups.
Quintile groups
One way to understand how consumption expenditure varies in the country is to arrange the population in order of increasing consumption expenditure (MPCE) and then divide them into five equal groups, or "quintiles".
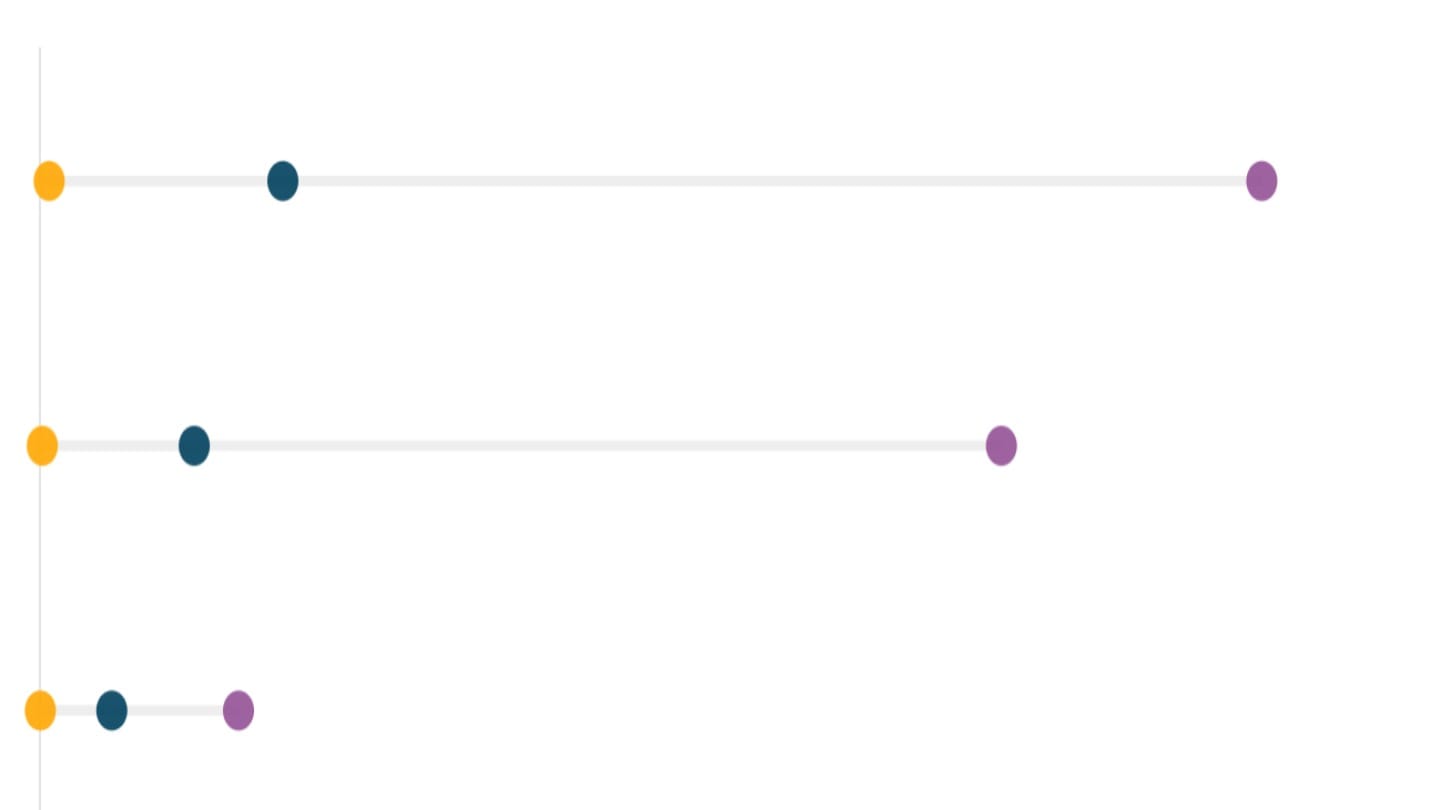
Urban expenditure is higher than rural expenditure at every quintile, but the gap is most pronounced in the highest quintile. In the lowest quintile, the average urban MPCE is 50% higher than the average rural MPCE. In the highest quintile, however, urban MPCE is 90% more than rural MPCE.
Within the top quintile, the average consumption expenditure is driven up by a relatively small group. In urban India, the average MPCE of the top 5% (accounting for roughly 25 million people), is above Rs 20,000, and that in rural areas is above Rs 10,000 (approximately 45 million people)[8].
Disparities between social groups
People belonging to marginalised groups, including those belonging to scheduled castes and scheduled tribes, have lower consumption expenditures, while among religious groups, Muslims and Buddhists have lower levels of consumer spending.
Regional variations
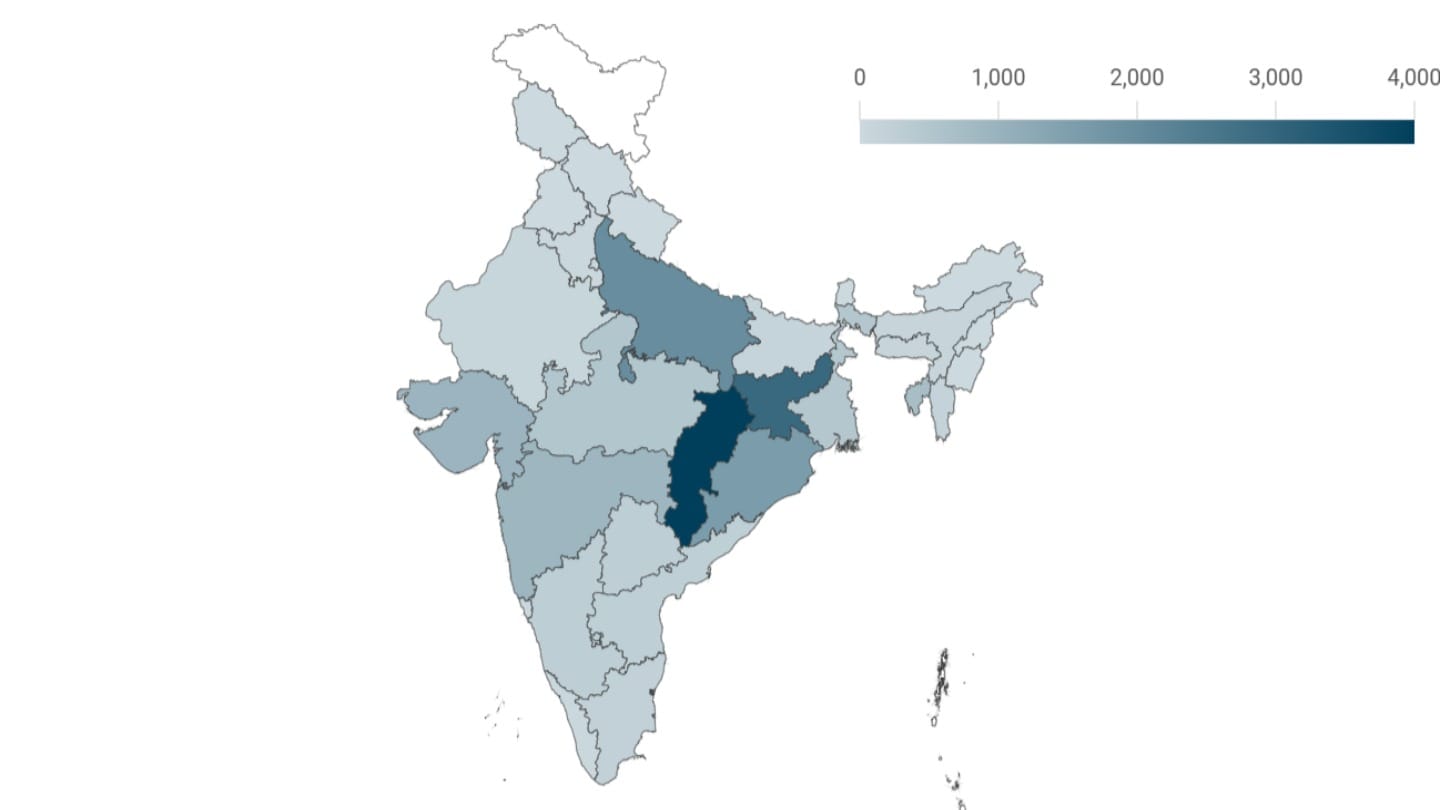
Central and eastern India has states with the lowest per capita consumption expenditure, while states in southern India, in and around the national capital of Delhi, and some in the northeast are among those with higher per capita expenditure. The average MPCE in Kerala and Tamil Nadu is double that of Chhattisgarh and Jharkhand.
Changes over time
The most recent consumption expenditure survey used a revised methodology, including changes in the way the sample was canvassed, as well as a changed format of asking questions, which could affect the comparability of the data[9]. (For a detailed discussion of these changes, see here.)
The NSSO says that the 2023 data can be compared with the past[10]. However, a simple comparison of consumption expenditure over time can be misleading. Two things broadly change over time - the volume of consumption and the prices of goods and services. With rising prices, it becomes difficult to see how much consumption actually grew, as against how much rising expenditures were affected by rising prices.
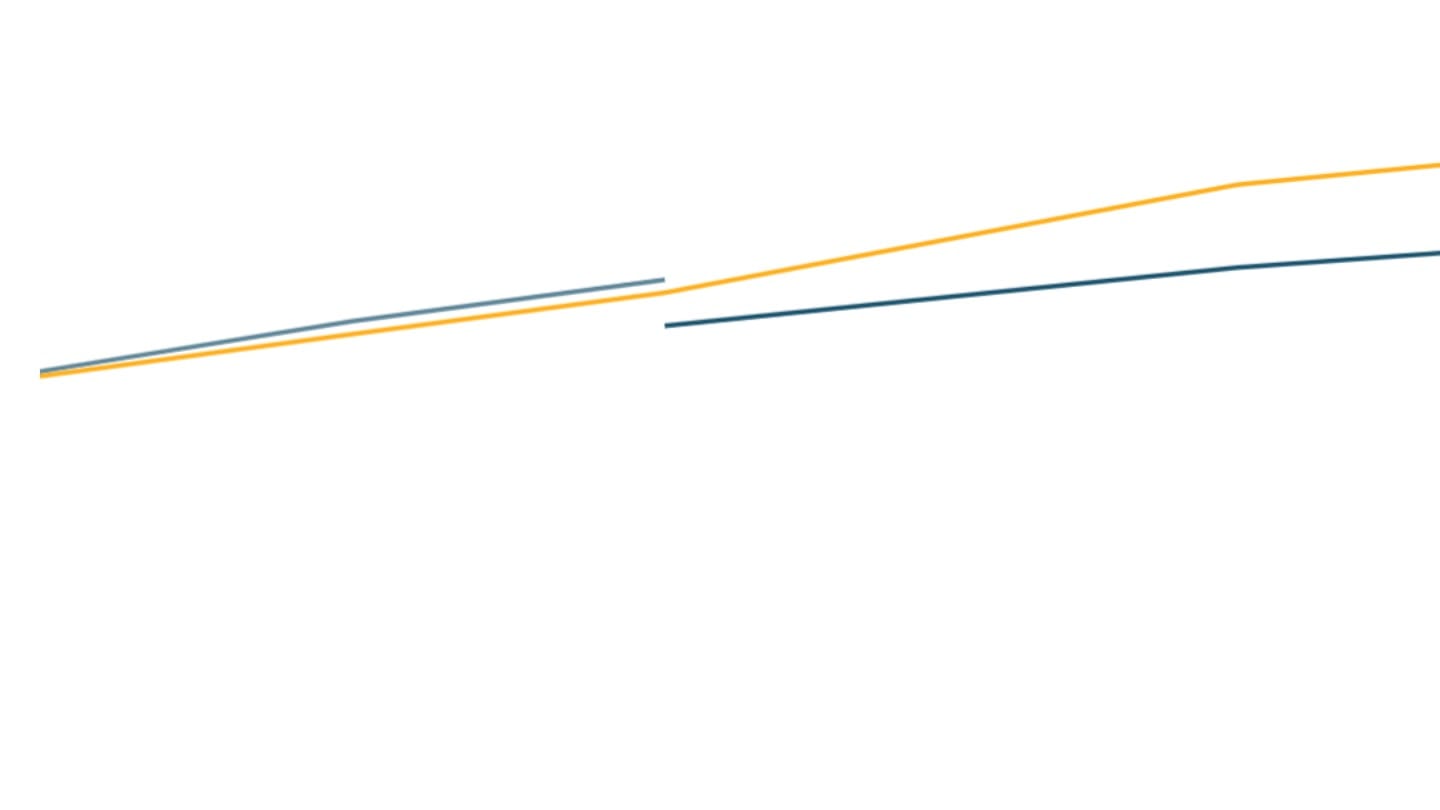
Adjusting expenditures for inflation shows the change in consumption expenditures in "real terms[11]." This shows that consumption expenditure grew in both nominal and real (inflation-adjusted) terms over time, but at different rates of growth.
Falling share of food
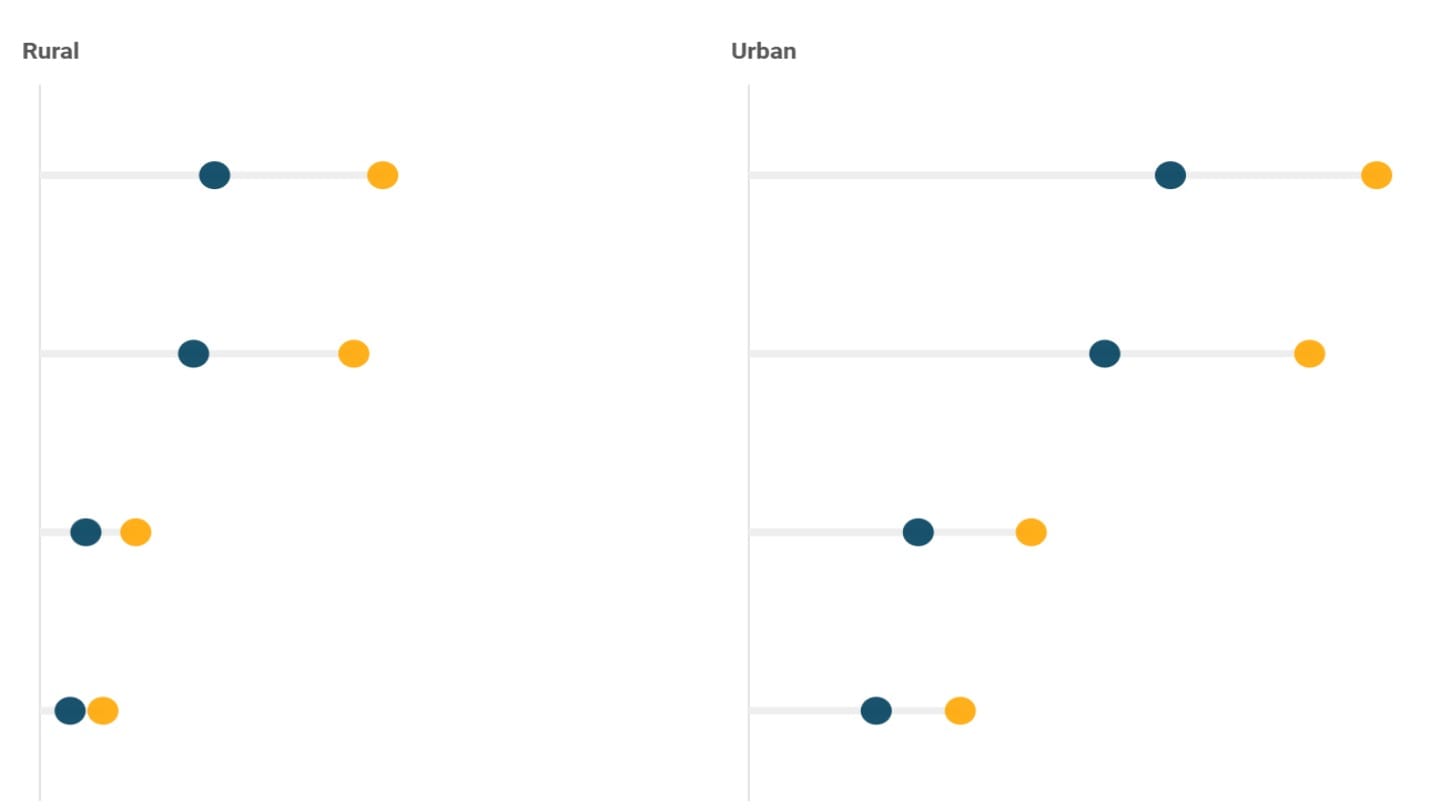
Food now occupies less than half of rural and urban monthly expenditure, and this share has seen a steep fall over the last few decades[12]. In the 1960s, 80% of the rural household budget and nearly 70% of the urban household budget, on the other hand, was on food alone. This is in line with trends seen across the world, where growth in incomes and a move away from manual labour leads to relatively lower spending on food[13].
This is driven by a big decline in relative spending on cereals. Indians now consume a smaller absolute quantity of cereals per person per month than before - from 2000 to 2023, the quantity of cereals consumed has dropped by nearly 25%[14]. Additionally, the expanded National Food Security Act now provides free grains to 75% of the rural and 50% of the urban population in India. As a result, spending on cereals now occupies less than 5% of the MPCE, from 22% in rural areas and 12% in urban areas in 2000.
On the other hand, fruits, eggs, fish and meat, processed food have seen their share in MPCE rise over the last few decades. One of the most significant changes in Indian spending has been on processed foods, which include packaged food, beverages and purchased cooked meals. Their share in the monthly per capita consumption expenditure has nearly doubled in the last two decades.
Rising non-food expenditures
Since 2000, while expenditure on food grew six times, per capita non-food spending grew nearly ten times in India.
Within non-food expenditure, transport and purchase of durable goods are the item groups that saw the fastest jump in the share in MPCE over time. About 7-8% of MPCE was spent on conveyance in 2023, compared to 3% and 5% in rural and urban Indian in 2000. The share of monthly spending on durable goods (including furniture and large appliances) has more than doubled to about 7% in 2023. In urban India, spending on education is another area that has seen substantial growth.
[1] The only major national survey that estimates income is the India Human Development Survey conducted jointly by the National Council for Applied Economic Research and the University of Maryland. The latest survey results are expected in 2025.
[2] The first HCES was carried out in 1950, but the five-yearly surveys that are comparable to current data began in 1972. The 2017-18 survey data was withdrawn, so the 2022-23 survey is the first one since 2011-12.
[3] Until now, the entire HCES questionnaire was asked to sample households in a single visit. In the latest Household Consumption Expenditure Survey, enumerators visit every sample household three times in successive months to canvas the survey schedule that is broken up into three parts.
The latest HCES also uses land ownership and distance to urban centres as key criteria in the sampling design and household selection for rural areas, and car ownership as the criterion in urban areas. The previous HCES used consumption expenditure data from older surveys or assessed the relative affluence of households in the household selection procedure.
[4] For food items, intoxicants such as pan and alcohol, and the energy consumed in cooking and electricity, the respondent is asked the quantity as well as the value of consumption. The value or the amount spent is recorded either directly (if the respondent knows it), or using prices prevalent in the region multiplied by the recorded quantity. For all other items, the respondent gives only the amount spent.
[5] The state provides free as well as subsidised food to households in India (both central and state governments). The recent survey captures the quantity of cereals in three parts: free, subsidised (under the public distribution system) and from other sources, mainly from the market. The quantity and value are recorded separately for each of them. The value of freely received cereals can be imputed using prevalent prices.
[6] While insurance premium is not a part of consumption expenditure, medical bills paid by insurance companies are included.
[7] Except for the exclusions mentioned above
[8] The HCES is a sample survey, and the 2023 edition covers a little more than 260,000 households across the country. DFI uses ratios from the survey, and applies them to population projections made by the Registrar General of India, to produce estimates of absolute population.
[9] Apart from the changes in sampling methodology and questionnaire canvassing (discussed in a footnote above and detailed in the Measurement piece), the list of items for which expenditure was recorded has increased from about 350 in the last HCES to 400+ in the latest one.
[10] The report accompanying the HCES data makes this comparison.
[11] The National Sample Survey Office uses the ratio of prices (price indices) to deflate or inflate prices over a period. The Consumer Price Index for Agricultural Labourers (rural) and CPI Industrial Workers (urban) are used to inflate the consumption expenditures in years prior to 2011 to prices of 2011-12 (base year). Similarly, the new series of Consumer Price Index - Rural and Urban is used to deflate the consumption expenditures in years after 2011, to 2011-12 prices.
[12] In economics, the fall in the share of food in total consumer expenditure is known as the Engel's Law, and it observes that the share of non-food items grows faster than food items as household income grows.
[13] Food accounts for 15% of the disposable income in advanced economies like the US and Germany.
[14]HCES 2022-23


